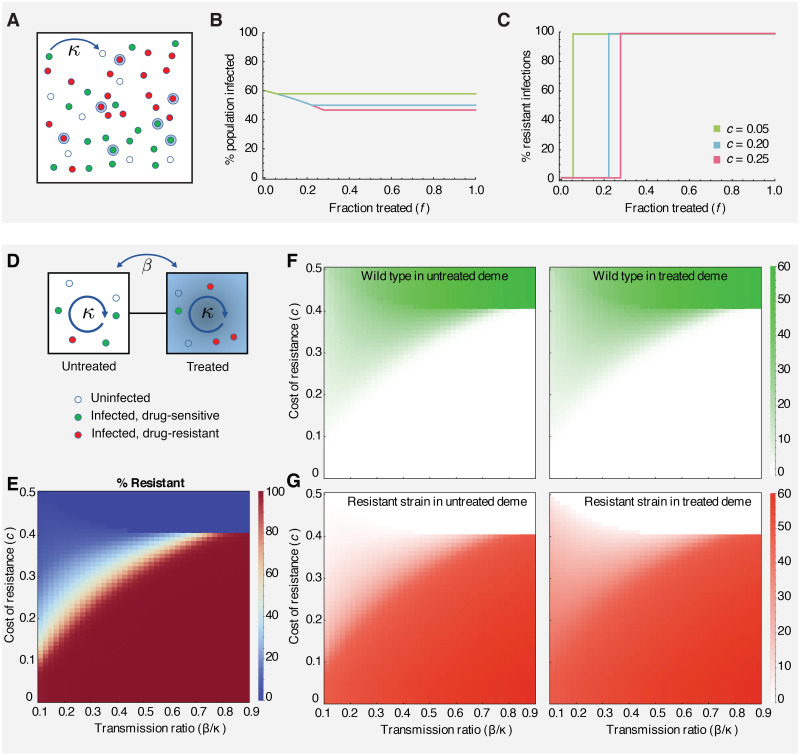
Fig 3. Competition between drug-sensitive and drug-resistant strains in a single well-mixed population (A-C) and two interconnected subpopulations (D-G).
A) A population of individuals in a single well-mixed deme, in which a fraction f receive drug treatment (blue haloes). Individuals may be uninfected (hollow blue circles), or infected with either the wild-type (green circles) or drug-resistant (red circles) strain. B) The total prevalence of infection (wild-type + drug-resistant) as a function of the fraction of treated individuals (f) for different costs of resistance (c). C) The % of infections that are drug-resistant as a function of the fraction of treated individuals (f) for different parameters. Infection switches between 0% and 100% resistant when f = c/ϵ. Coexistence never occurs. D) Schematic of a two-deme population (left-untreated, right-treated) and the two strains (green-wild type, red-resistant) considered in the model. E-G) Each panel shows the infection level (shading) as a function of the relative connectivity between demes (β/κ) and the cost of resistance (c). E) The % of all infections that are drug-resistant strain across the entire population. F) The % of individuals in each deme who are infected with the wild type strain. G) The % of individuals in each deme who are infected with the resistant strain. For all results, the transmission rate is κ = 0.25/day, the recovery rate is g = 0.1/day, and the treatment efficacy is ϵ = 0.9.

