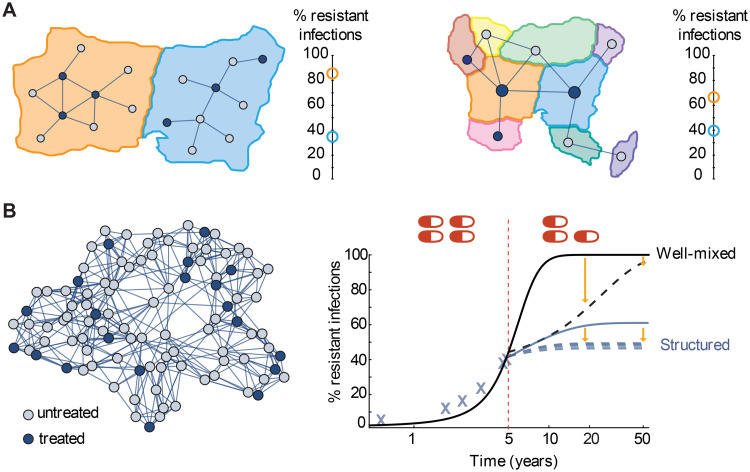
Fig 5. Implications for interpreting and predicting resistance levels.
A) Our analysis suggests two possible explanations for large differences in resistance levels between two regions (orange and blue) receiving similar amounts of antibiotics. Left: The regions may differ in the distribution of antibiotic consumption within the population and its connection with the underlying transmission network. Right: The regions may differ in their connectivity to other regions which consume different amounts of antibiotics. B) Predictions about the impact of interventions on future resistance levels can be incorrect if population structure isn’t accounted for. Left: A population consisting of 100 sub-populations, with 20% treatment coverage at baseline. Right: Simulations of resistance levels in the “true” structured population (blue) with and without a hypothetical intervention (reduction to 15% treatment) applied at year 5. For comparison, predictions of a well-mixed model that with the same parameters (black), which approximates the dynamics before year 5 but diverges afterwards. The well-mixed model would predict large reductions in resistance in the short term but eventual fixation of resistance nonetheless (black dashed line), whereas the structured model predicts modest but sustained reductions which depend on the particular sub-populations targeted (blue dotted lines), and long-term coexistence. All simulations used kinetic parameters κ = 0.25/day, β = 0.05/day, g = 0.1/day, and c = 0.2. For the left of (A) and for (B), ϵ = 0.9, and for the right of (A), ϵ = 0.5. The population in (B) is a Watts-Strogatz network with degree 4 and re-wiring probability 0.1.

