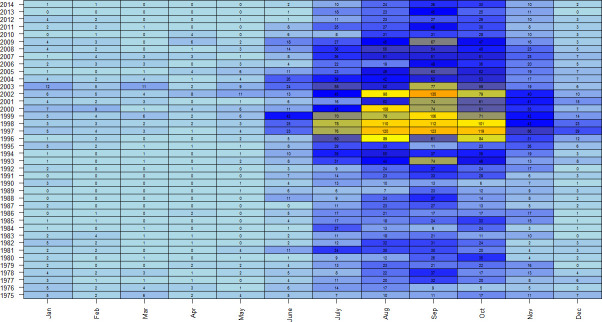
Figure 3.
Monthly distribution of lungworm cases recorded on the Veterinary Investigation Diagnosis Analysis database from any region of great Britain 1975 to 2014 (rows). Heatmap colours refer to number of cases from light blue (fewest cases) to dark orange (most cases). Numbers within cells refer to the number of cases diagnosed per month and year.

