
Fig. 3.
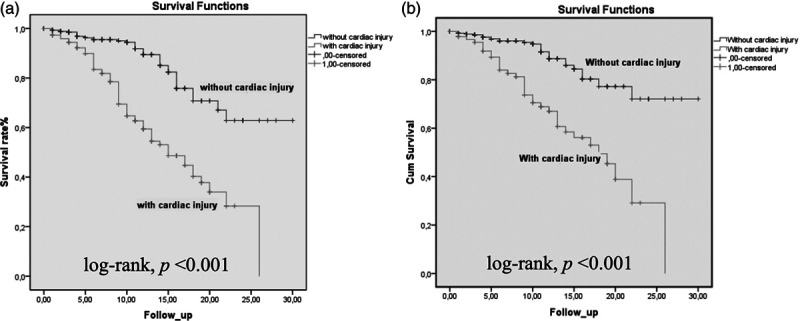
Kaplan–Meier survival curves for mortality during the time from admission. All patients (a) and patients without coronary artery disease (CAD) (b).
Official websites use .gov
A
.gov website belongs to an official
government organization in the United States.
Secure .gov websites use HTTPS
A lock (
) or https:// means you've safely
connected to the .gov website. Share sensitive
information only on official, secure websites.
Kaplan–Meier survival curves for mortality during the time from admission. All patients (a) and patients without coronary artery disease (CAD) (b).