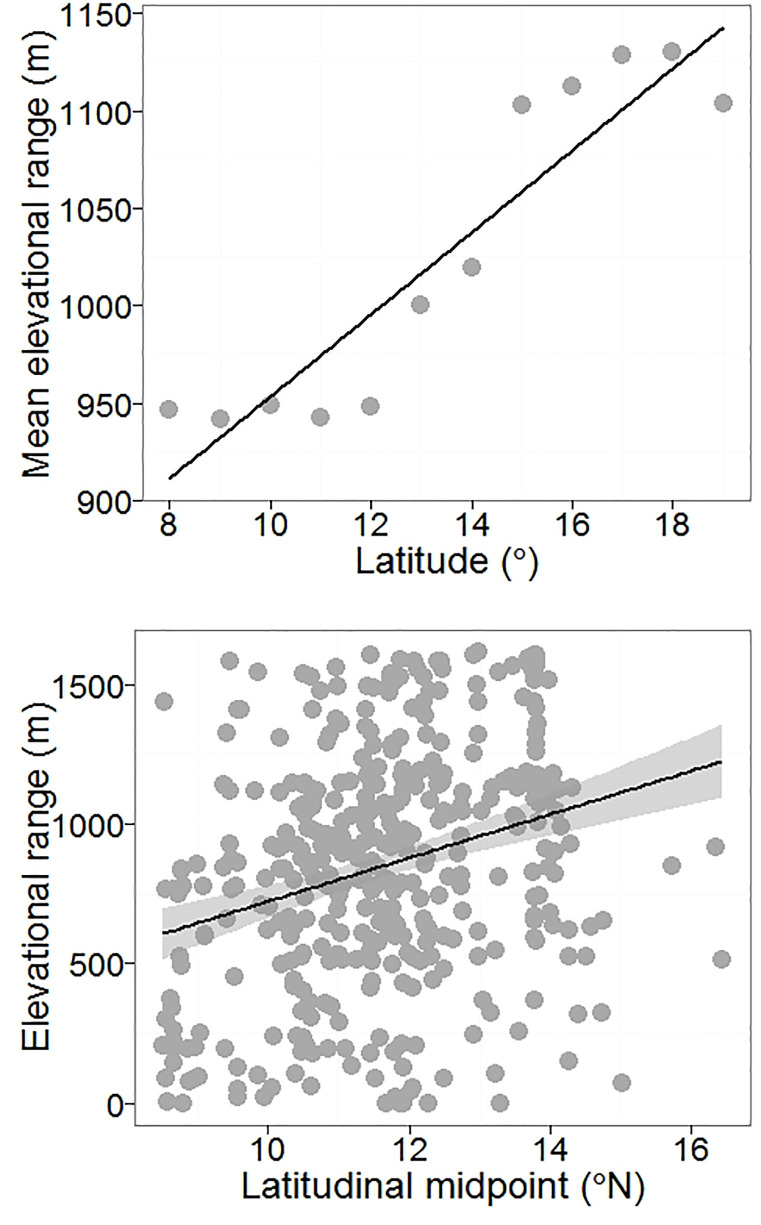
Fig 6. Latitudinal trends in species elevational ranges.
(a) Stevens’ method: Each point represents mean elevational range sizes of species recorded within every one degree latitude. Solid lines represent best fit using ordinary least squares (b) Midpoint method: Each data point represents elevational range of a single species plotting against the latitudinal midpoint of its geographic range.

