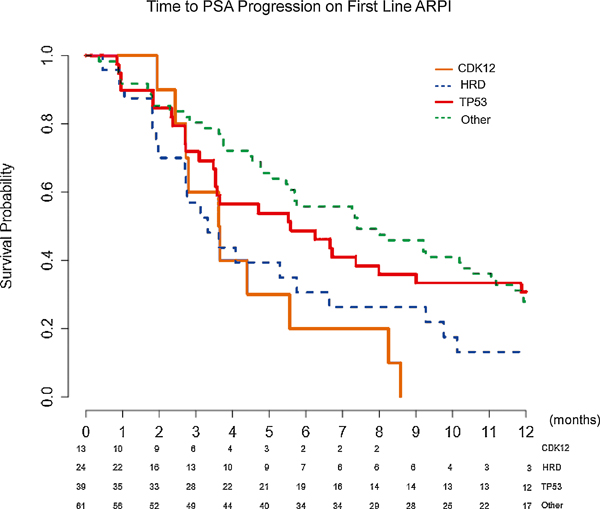
Fig. 5 –

Kaplan-Meier curves for time to PSA progression on first-line AR pathway inhibitor (ARPI) therapy. Median time to PSA progression: CDK12 3.6 mo, HRD 3.3 mo, TP53 5.6 mo, and other 7.4 mo. Overall p = 0.012. CDK12 versus HRD p = 0.47, CDK12 versus TP53 p = 0.069, CDK12 versus other p = 0.0023, HRD versus TP53 p = 0.063, HRD versus other p = 0.022, and TP53 versus other p = 0.67. The greatest difference was between the CDK12 and the other cohort (3.6 vs 7.4 mo, p = 0.0023). The p values are based on log rank test.
AR = androgen receptor; CDK12 = cyclin-dependent kinase 12; HRD = homologous recombination deficiency; PSA = prostate-specific antigen.
