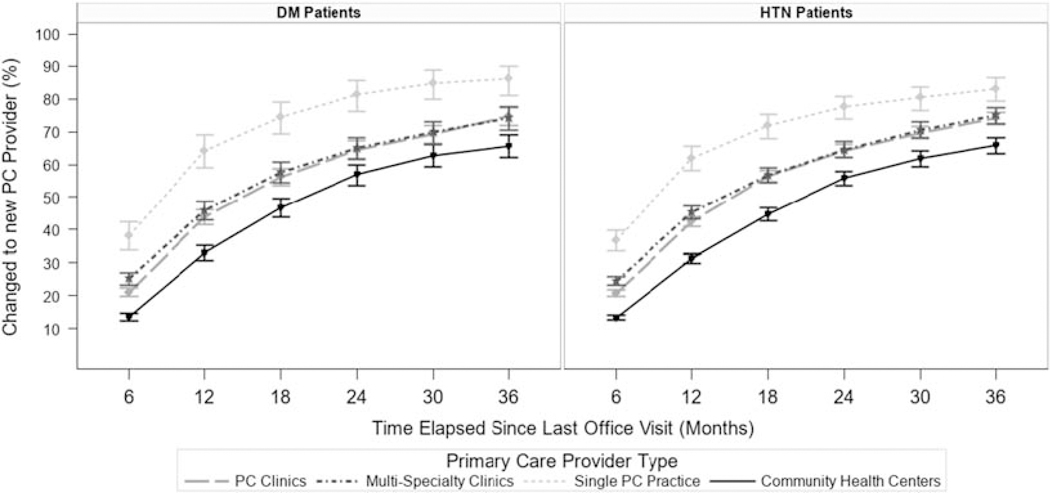
FIGURE 2.

Percent of PC patients in the 2014 cohort changed their PC provider by time elapsed since their visit to their last provider, stratified by disease diagnosis (diabetes or hypertension). The percent of patients who changed provider was modeled using GEE logistic regression. As patients could have multiple gaps at a specified length (multiple gaps of 6 mo or more between visits resulting in multiple observations per patient within each analysis), we used GEE models to account for within-patient correlation using a robust sandwich variance estimator. GEE models included PC provider type, cohort year, and the interaction term between those 2 terms. Odds ratios from GEE logistic models were transformed to estimate predicted probabilities of provider change has occurred. Models were stratified by the year in which the PC visit starting the time interval occurred. Patients with both diabetes and hypertension were included in both cohorts. Results for time intervals starting in 2014 are presented; results for 2012 and 2013 are included in Appendix 3 (Supplemental Digital Content 3, http://links.lww.com/MLR/B970). DM indicates diabetes mellitus; GEE, generalized estimating equation; HTN, hypertension; PC, primary care.
