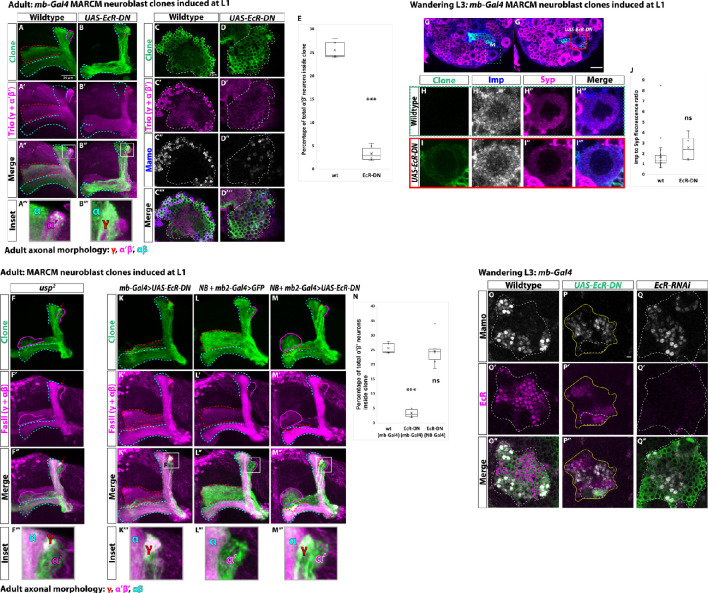
Figure 6. Ecdysone signaling is not necessary for α’β’ specification.
(A-B) Representative max projections showing adult axons of clonally related neurons born from L1 stage in wildtype and UAS-EcR-DN conditions. UAS-CD8::GFP is driven by mb-Gal4 (OK107-Gal4). Outlines mark GFP+ axons, where γ axons are outlined in red, α’β’ axons are outlined in magenta, and αβ axons are outlined in cyan. A white box outlines the Inset panel. Trio (magenta) is used to label all γ and α’β’ axons for comparison to GFP+ axons. (A) In wildtype, GFP+ axons are visible in all mushroom body lobes. (B) α’β’ axons are lost, and γ neurons do not remodel, in UAS-EcR-DN expressing clones. (C-D) Representative, single z-slices from the adult cell body region of clones induced at L1 in wildtype and UAS-EcR-DN conditions. UAS-CD8::GFP is driven by mb-Gal4. (C) Wildtype clones show the presence of strongly expressing Trio (magenta) and Mamo (blue, gray in single channel) neurons, indicative of α’β’ identity. (D) In UAS-EcR-DN clones, strong Trio and Mamo cells are not present. (E) Quantification of MARCM clones marked by mb-Gal4, which labels all mushroom body neuronal types. The number of α’β’ neurons are quantified in wildtype (n = 7, replotted from data in Figure 1H) and UAS-EcR-DN (n = 6) conditions. Plotted is the percentage of strong Mamo+ and GFP+ cells (clonal cells) versus all Mamo+ cells (clonal and non-clonal cells) within a single mushroom body. In wildtype, 25.5 ± 0.7% of the total strong Mamo expressing cells (α’β’ neurons) are within clones. In UAS-EcR-DN clones, only 3.4 ± 0.6% of α’β’ neurons are within clones. (F) usp mutant clones contain α’β’ neurons. FasII (magenta) is used to label γ and αβ lobes. Red arrow indicates unpruned γ neurons. (G) Representative image of an UAS-EcR-DN expressing neuroblast marked by UAS-CD8::GFP driven by mb-Gal4 (red box) ventral to a wildtype neuroblast (green-dashed box) from the same wandering L3 stage brain, immunostained for Imp (blue, gray in single channel) and Syp (magenta). (H) Close-up view of wildtype neuroblast (green-dashed box in G). (I) Close-up view of UAS-EcR-DN neuroblast (red box in G). (J) Quantification of the Imp to Syp ratio in UAS-EcR-DN neuroblasts (n = 4 from four different brains) compared to wildtype (n = 27 from the same four brains as UAS-EcR-DN neuroblasts). (K) A representative adult mushroom body clone (green) induced at L1 expressing UAS-EcR-DN driven by mb-Gal4. α’β’ neurons (GFP+ (green), FasII- (magenta)) are not observed and γ neurons do not remodel (GFP+, FasII+, red outline). (L) A representative adult wildtype clone induced at L1 driven by NB + mb2-Gal4. All three neuron types are present, including α’β’ neurons (GFP+, FasII-, magenta outline). (M) α’β’ neurons are also present when UAS-EcR-DN is driven by NB + mb2-Gal4 although γ neurons do not remodel. (N) Quantification of MARCM clones in which UAS-EcR-DN is driven by mb-Gal4 (n = 6, replotted from data in E) or NB + mb2-Gal4 (n = 6) compared to wildtype (n = 7, replotted from data in Figure 1H). In UAS-EcR-DN clones driven by NB + mb2-Gal4, 24.6 ± 2.1% of α’β’ neurons are within a clone, similar to wildtype. O. At L3, Mamo (gray) is expressed in young mushroom body neurons (α’β’) while EcR (magenta) can only be detected in more mature neurons (mainly γ at this stage). Note that there is no overlap between Mamo and EcR. (P) Expressing UAS-EcR-DN with mb-Gal4 (green, white outline) leads to the loss of Mamo expression (gray) inside the clone but not in surrounding wildtype mushroom body neurons. (Q) In contrast, expressing UAS-EcR-RNAi drivenE by mb-Gal4 abolishes EcR expression but does not affect Mamo. For E and J a two-sample, two-tailed t-test was performed. For N, a Tukey test was performed. ***p<0.001, ns: not significant. Scale bars: A, 20 µm; G, 10 µm; P, 5 µm.


