Figure 1.
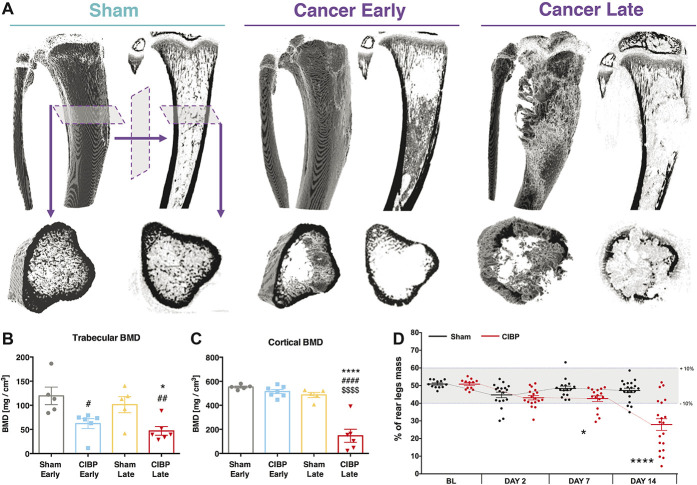
The impact of cancer progression on bone innervation. Example microcomputer tomography reconstructions of rat tibiae. Panels depict a sham-operated control, an early (day 7/8) and a late (day 14/15) cancer stage. Top panels represent a whole 3D-rendered tibia with corresponding orthogonal projection. Bottom panel shows a plantar representation of selected microscans from the top panel. An early cancer stage is characterised by the trabecular bone lesions, whereas the late stage by both trabecular and cortical bone lesions (A). Trabecular bone mineral density quantification is shown (volumetric bone mineral density quantification from 114 reconstructed microscans (every 34 µm) per bone. Selected planes for analysis were chosen to cover the tumour growth area (see methods for details). Each dot represents a single bone from a separate animal. Data represent the mean ± SEM (in mg/cm3). One-way ANOVA with Tukey post hoc test: *or #P < 0.05, ##P < 0.01. #vs early sham, *vs respective sham (B). Cortical bone mineral density quantification is shown. Data represent the mean ± SEM (in mg/cm3). One-way ANOVA with Tukey post hoc test: ****P < 0.0001. #vs early sham, *vs late sham, $vs early cancer (C). Static weight-bearing measurement of rear legs. Within a timepoint, each dot represents a single animal (n = 13-20 per group). Each measurement was taken as an average of 5 consecutive readouts per animal per timepoint. All data represent the mean ± SEM. Kruskal–Wallis H for independent samples: *P < 0.05, ****P < 0.0001 vs respective sham (D). See also Figs. S2 and S3, available at http://links.lww.com/PAIN/A994. ANOVA, analysis of variance.

