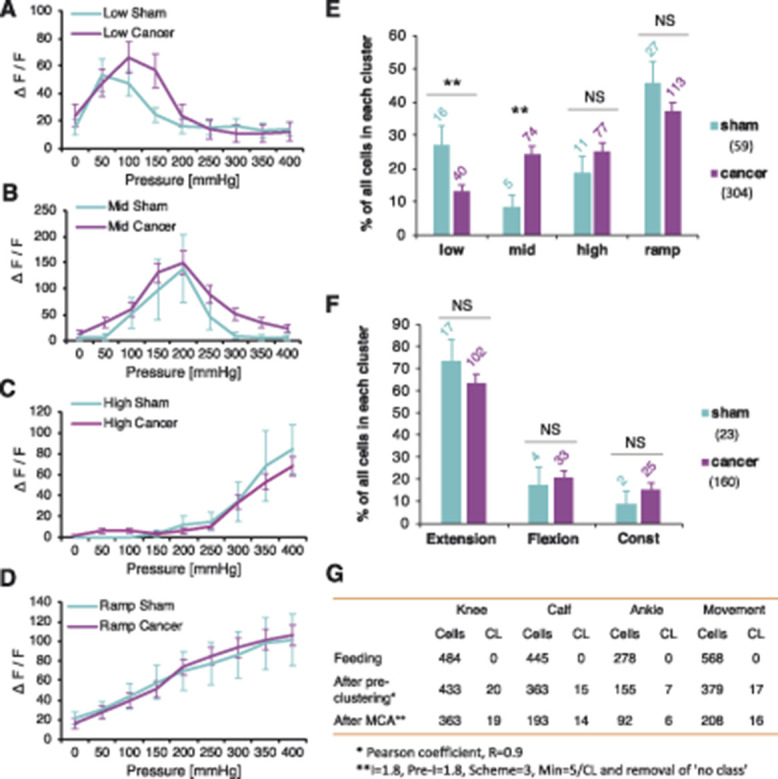
Figure 6.

Leg compression and position are differentially coded by DRG sensory neurons. “Low” cluster of neuronal responses to the knee compression revealed by Markov Cluster Analysis (MCA) with respect to the treatment group. n = 16 cells (sham) from 3 animals, and n = 40 cells from 10 animals (cancer). Repeated-measures ANOVA: nonsignificant (vs sham) (A). “Mid” cluster of neuronal responses to the knee compression revealed by Markov Cluster Analysis with respect to the treatment group. n = 5 cells (sham) from 4 animals, and n = 74 cells from 10 animals (cancer). Repeated-measures ANOVA: nonsignificant (vs sham) (B). “High” cluster of neuronal responses to the knee compression revealed by Markov Cluster Analysis with respect to the treatment group. n = 11 cells (sham) from 2 animals, and n = 77 cells from 10 animals (cancer). Repeated-measures ANOVA: nonsignificant (vs sham) (C). “Ramp” cluster of neuronal responses to the knee compression revealed by Markov Cluster Analysis with respect to the treatment group. n = 27 cells (sham) from 3 animals, and n = 113 cells from 10 animals (cancer). Repeated-measures ANOVA: nonsignificant (vs sham) (D). Percentage of cells in each knee compression cluster with regards to the group classifiers is shown. Data represent the mean ± SEM. Numbers over the bars represent total numbers of cells identified in each cluster. Total numbers of cells after MCA in sham and cancer groups are given in brackets. Unpaired t test: **P < 0.01, NS, nonsignificant (E). Percentage of cells in each movement cluster with regards to the group classifiers is shown. Data represent the mean ± SEM. Numbers over the bars represent total numbers of cells identified in each cluster. Total numbers of cells after MCA in sham and cancer groups are given in brackets. Unpaired t test: NS, nonsignificant (F). Summary table of all responders after each step of MCA performed with respect to different stimulus (See Fig. S2A, available at http://links.lww.com/PAIN/A994). CL reflects number of clusters present at each step of the analysis before final manual merging (G). Data represent the mean ± SEM. ANOVA, analysis of variance; DRG, dorsal root ganglia.
