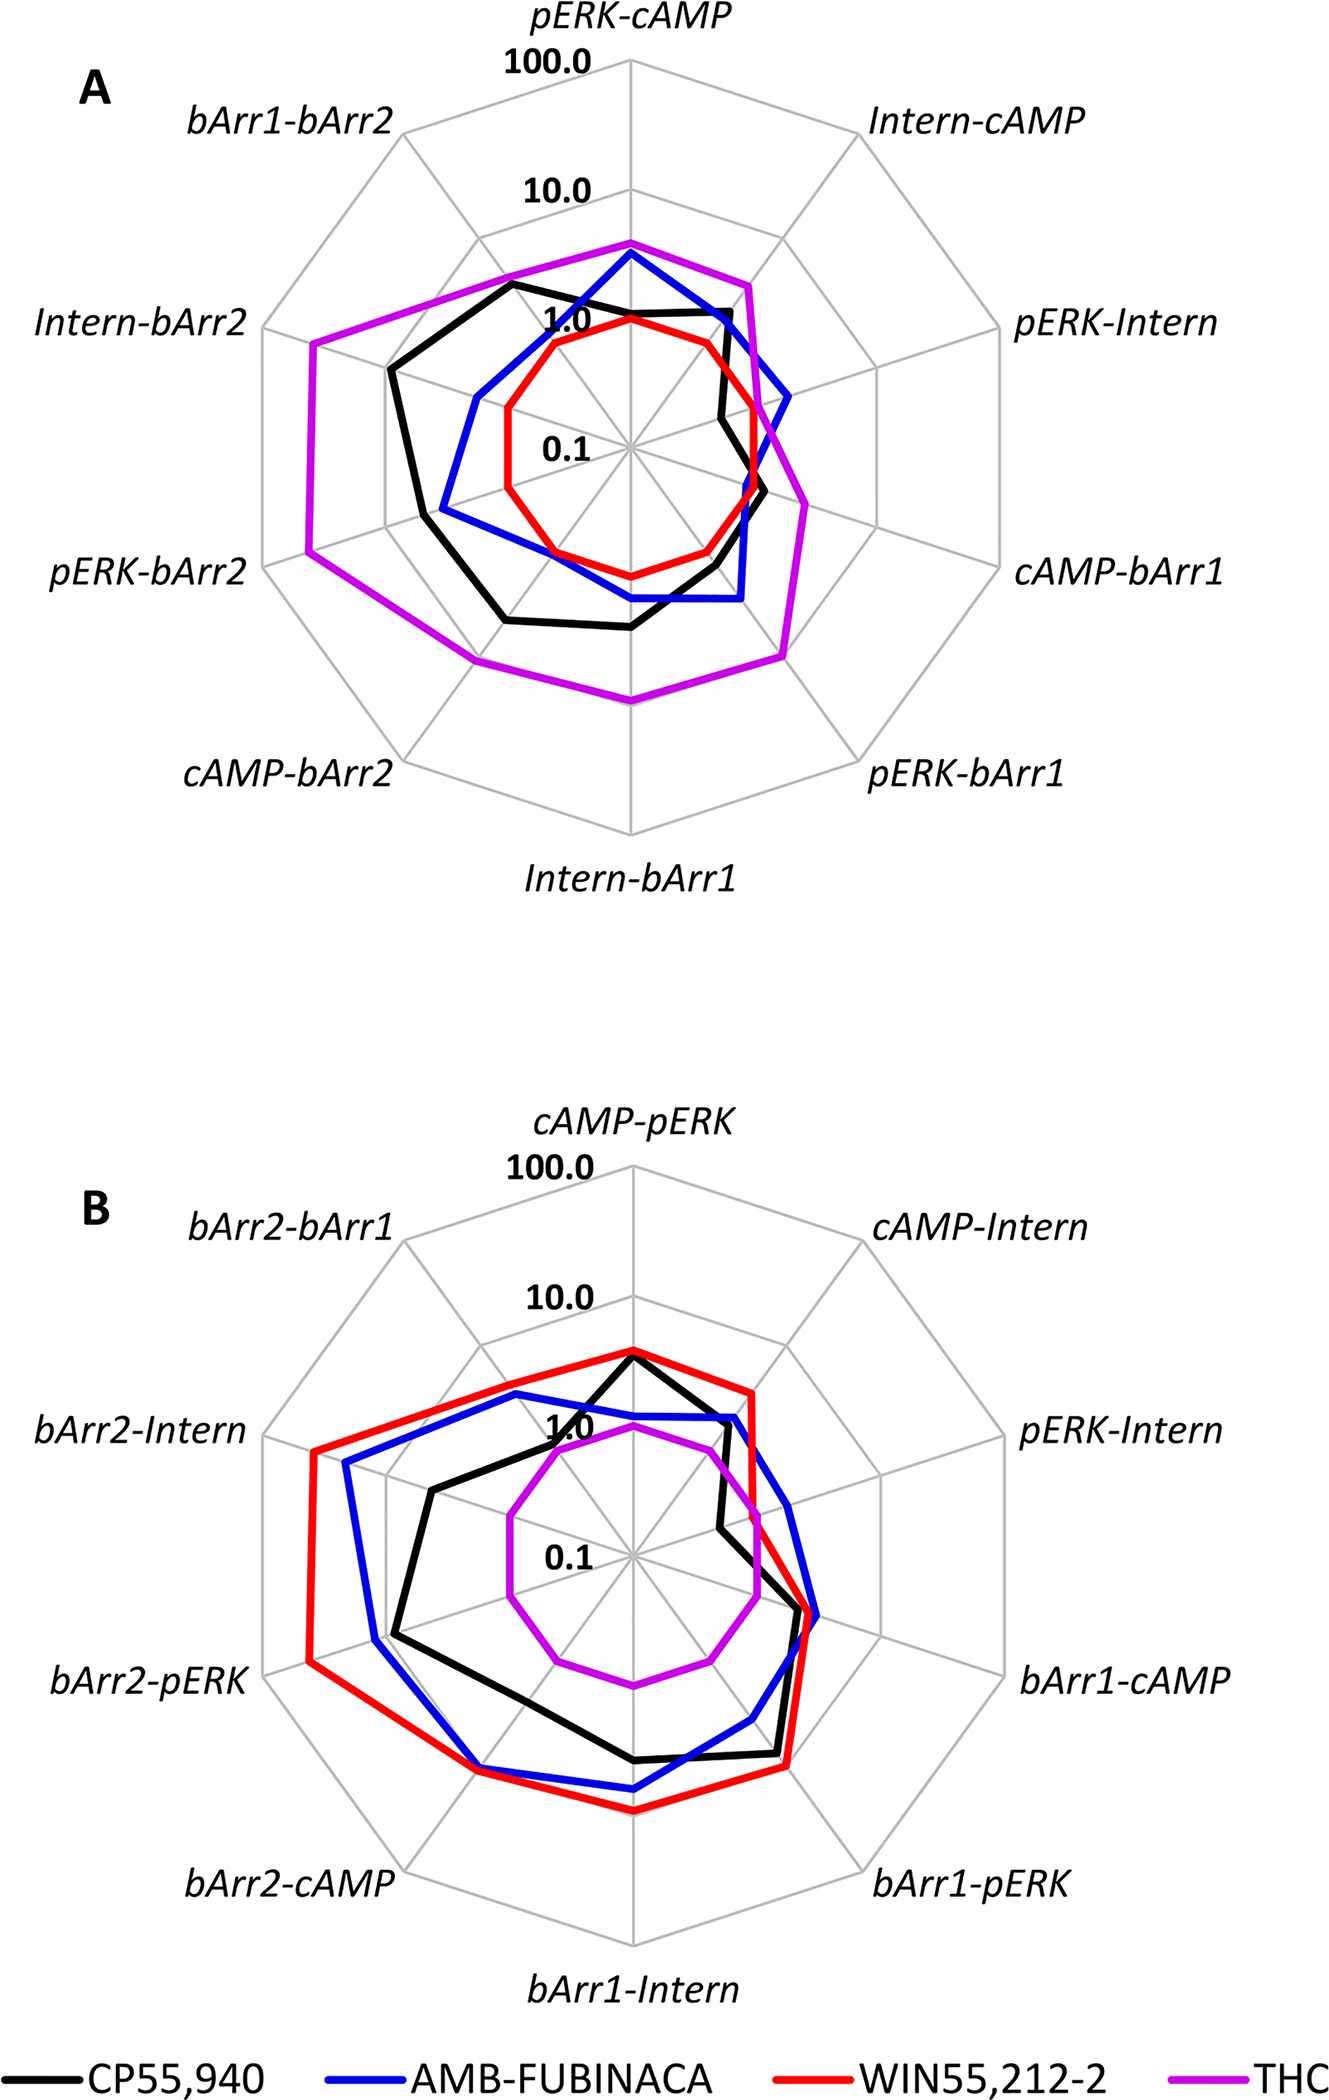
Figure 5.

Radar plot showing operational analysis bias factors (10ΔΔlogR) for CP55,940, AMB-FUBINACA, WIN55,212–2, and Δ9-THC in all pathway comparisons assayed. The reference ligand is WIN55,212–2 (A) or Δ9-THC (B). Data (log R values) were collated from all available independent determinations (n = 3–4). Bias is indicated for the first pathway named in each comparison (each vertex) as bias factors > 1.0 (or vice versa). Note that the order of pathway comparisons is not always consistent between (A) and (B) in order that as many comparisons as possible will return values > 1.0.
