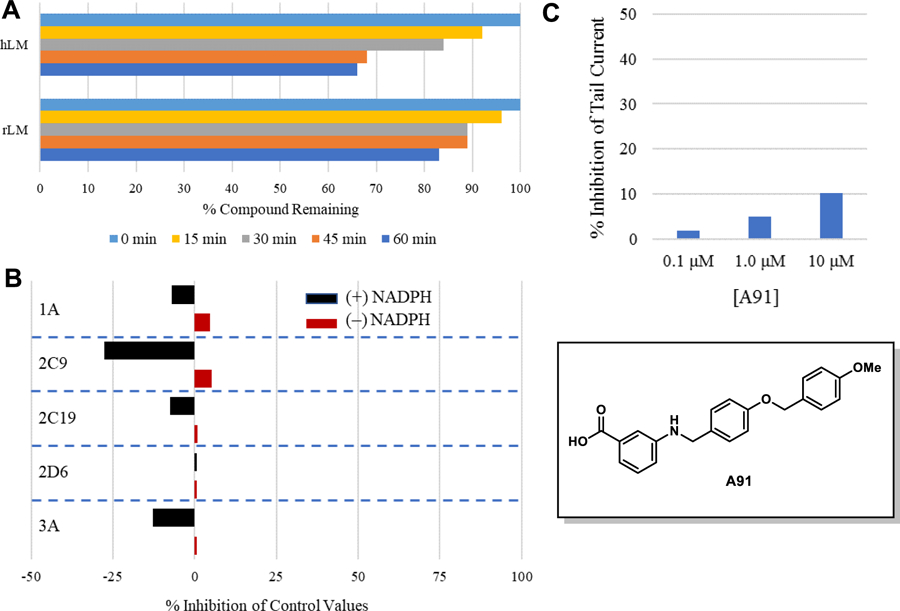
Figure 2. Pharmacokinetic profile of A91.

(A) Stability in liver microsomes. A91 was pre-incubated with pooled liver microsomes in phosphate buffer (pH 7.4) for 5 min at 37 °C. The system was activated by the addition of an NADPH-regenerating system and incubated for 0, 15, 30, 45, and 60 min before being quenched with an acetonitrile/methanol mixture. Samples were processed and analyzed by HPLC-MS/MS to determine the peak area remaining. Experiments completed in duplicate and mean values are depicted. (B) Assessment of A91 (10 μM) for irreversible inhibition of the major CYP450 drug metabolizing isoforms. Peak areas corresponding to the metabolite of known substrates for each isoform are recorded. The percent of control activity was calculated by comparing the peak area obtained in the presence of A91 to that obtained in the absence of A91. Percent inhibition was calculated by subtracting the percent control activity from 100. Time-dependent CYP inhibition is demonstrated if the percent inhibition from samples pre-incubated with the NADPH-regenerating system is larger than those without NADPH-regeneration. Negative values are a reflection of the variability in the background noise of the experiment. Experiments completed in duplicate and mean values are depicted. (C) Assessment of A91 for inhibition of the hERG channel. The degree of inhibition (%) was obtained by measuring the tail current amplitude, which is induced by a one-second test pulse to −40 mV after a two-second pulse to +20 mV, before and after drug incubation. Experiments completed in duplicate and mean values are depicted.
