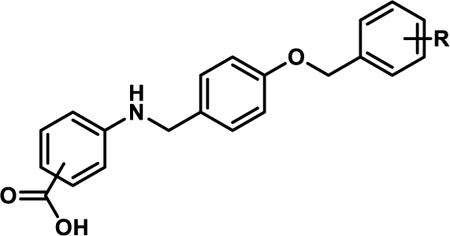
Table 1.
In vitro Activity of 4a-la
 | |||||||
|---|---|---|---|---|---|---|---|
| Compound | R | Ratio (5/50)b | Fold-Signalc | EC50 hPPARα (μM)d | EC50 hPPARγ (μM) | EC50 hPPARδ (μM) | SIe |
| 4a (A91) | 4-OMe | 0.5 | 1.4 | 4.43±0.01 | >100 | >100 | >20 |
| 4b | 4-F | 0.8 | 1.3 | 0.77±0.03 | >100 | >100 | >125 |
| 4b* | 4-F | 0.3 | 0.4 | ||||
| 4c | 4-Cl | 0.6 | 1.5 | 0.83±0.04 | |||
| 4d | 4-Br | 0.8 | 1.3 | 0.97±0.14 | |||
| 4e | 4-I | 0.7 | 1.1 | 1.45±0.02 | |||
| 4f | 4-CF3 | 0.9 | 0.9 | 0.96±0.11 | |||
| 4g | 4-CN | 0.6 | 1.0 | ||||
| 4h | 2-F | 0.8 | 1.0 | ||||
| 4i | 3-F | 0.9 | 1.2 | 1.18±0.05 | |||
| 4j | 2,4-difluoro | 1.2 | 1.2 | 0.54±0.09 | >100 | >100 | >175 |
| 4k | 3,4-difluoro | 1.1 | 1.2 | 0.36±0.01 | |||
| 4l | 3,5-difluoro | 1.1 | 1.1 | ||||
| GW590735 | 1.0 | 1.0 | 0.015±0.002 | ||||
| Rosiglitazone | 0.28±0.3 | ||||||
| GW0742 | 0.0019±0.002 | ||||||
All analogues contain the carboxylate head-group at the meta-position of the A-ring unless otherwise indicated.
indicates a para-carboxylate.
Ratio of relative light unit (RLU) signal at 5 μM and 50 μM compound concentrations.
Ratio of maximal signal strength observed for the compound of interest to that obtained with GW590735.
EC50 values represent the mean ± SEM of atleast two separate experiments performed in triplicate.
SI = EC50 (PPARγ or PPARδ) / EC50 (PPARα). Blank cells indicate compound was not selected for testing in the corresponding assay.
