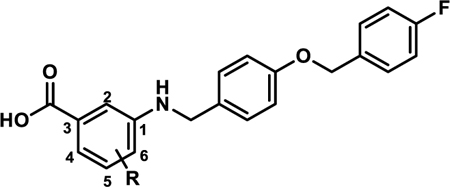
Table 4.
In vitro Activity of 4p-s
 | |||||||
|---|---|---|---|---|---|---|---|
| Compound | R | Ratio (5/50)a | Fold-Signalb | EC50 hPPARα (μM)c | EC50 hPPARγ (μM) | EC50 hPPARδ (μM) | SId |
| 4p | 4-F | 0.8 | 1.2 | 1.61±0.06 | |||
| 4q | 5-F | 1.1 | 1.1 | 0.58±0.04 | >100 | >100 | >170 |
| 4r | 5-Cl | 0.1 | 1.1 | ||||
| 4s | 5-Br | 1.3 | 1.4 | 1.12±0.08 | >100 | >100 | >100 |
Ratio of relative light unit (RLU) signal at 5 μM and 50 μM compound concentrations.
Ratio of signal maximal signal (RLU) strength observed for the compound of interest to that obtained with GW590735.
EC50 values represent the mean ± SEM of atleast two separate experiments performed in triplicate.
EC50 (PPARγ or PPARδ) / EC50 (PPARα). Blank cells indicate compound was not selected for testing in the corresponding assay.
