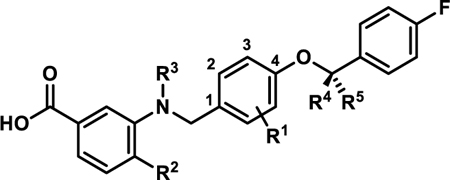
Table 5.
In vitro Activity of 4t-z
 | |||||||||
|---|---|---|---|---|---|---|---|---|---|
| Compound | R1 | R2 | R3 | R4 | R5 | Ratio (5/50)a | Fold-Signalb | EC50 hPPARα (μM)c | SId |
| 4t | 2-Me | H | H | H | H | 0.8 | 1.2 | 1.45±0.06 | |
| 4u | 3-Me | H | H | H | H | 1.4 | 1.2 | 0.037±0.01 | >2700 |
| 4v | H | Me | H | H | H | 0.2 | 0.3 | ||
| 4w | H | H | Me | H | H | 0.8 | 1.7 | 0.90±0.08 | |
| 4x | H | H | H | Me | H | 0.1 | 0.6 | 25.6±3.5 | |
| 4y | H | H | H | H | Me | 0.2 | 1.6 | ||
| 4z | H | H | H | Me | Me | 0.2 | 0.8 | 8.52±1.83 | |
| 4a (A91) | 0.5 | 1.4 | 4.43 ± 0.01 | >20 | |||||
| 4b | 0.8 | 1.3 | 0.77 ± 0.03 | >125 | |||||
| GW590735 | 1.0 | 1.0 | 0.015±0.002 | ||||||
Ratio of relative light unit (RLU) signal at 5 μM and 50 μM compound concentrations.
Ratio of signal maximal signal (RLU) strength observed for the compound of interest to that obtained with GW590735.
EC50 values represent the mean ± SEM of atleast two separate experiments performed in triplicate.
EC50 (PPARγ or PPARδ) / EC50 (PPARα). Blank cells indicate compound was not selected for testing in the corresponding assay.
