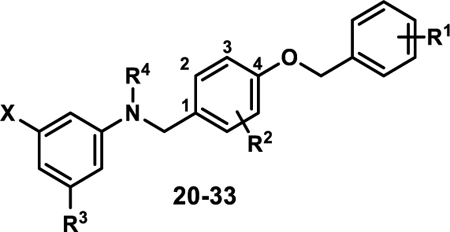
Table 7.
In Vitro Activity of Stage III Analogues
 | ||||||||
|---|---|---|---|---|---|---|---|---|
| Compound | X | R1 | R2 | R3 | R4 | Ratio (5/50)a | Fold-Signalb | EC50 hPPARα (μM)c |
| 20 | COOH | 4-Cl | 3-Me | H | H | 1.2 | 1.2 | 0.029±0.001 |
| 21 | COOH | 4-Br | 3-Me | H | H | 1.2 | 1.3 | 0.031±0.008 |
| 22 | COOH | 4-I | 3-Me | H | H | 1.8 | 1.5 | 0.027±0.003 |
| 23 | COOH | 2,4-difluoro | 3-Me | H | H | 1.2 | 1.4 | 0.056±0.007 |
| 24 | COOH | 3,4-difluoro | 3-Me | H | H | 1.4 | 1.6 | 0.018±0.001 |
| 25 | COOH | 3,5-difluoro | 3-Me | H | H | 1.1 | 1.6 | |
| 26 | COOH | 4-F | 3-F | H | H | 0.7 | 1.7 | |
| 27 | COOH | 4-F | 3-Cl | H | H | 1.1 | 1.5 | |
| 28 | COOH | 4-OPFB | 3-OPFB | H | H | 1.0 | 1.4 | 0.81±0.17 |
| 29 | COOH | 4-OPFB | 2-OPFB | H | H | 0.9 | 1.2 | 0.93±0.02 |
| 30 | COOH | 4-F | 3-Me | H | Me | 0.8 | 2.1 | 0.067±0.01 |
| 31 | COOH | 4-F | 3-Me | F | H | 0.9 | 1.5 | 0.040±0.001 |
| 32 | COOH | 4-F | 3-Cl | F | H | 1.1 | 1.8 | 0.052±0.011 |
| 33 | OC(CH3)2COOH | 4-F | 3-Me | H | H | 1.0 | 1.6 | 0.74±0.04 |
| 4b | 0.8 | 1.3 | 0.77±0.03 | |||||
| 4a (A91) | 0.5 | 1.4 | 4.43±0.01 | |||||
| GW590735 | 1.0 | 1.0 | 0.015±0.002 | |||||
Ratio of relative light unit (RLU) signal at 5 μM and 50 μM compound concentrations.
Ratio of signal maximal signal (RLU) strength observed for the compound of interest to that obtained with GW590735.
EC50 values represent the mean ± SEM of atleast two separate experiments performed in triplicate. OPFB = para-fluorobenzyl. Numbering shown is based on the name of the resulting products. Blank cells indicate compound was not selected for testing in the corresponding assay.
