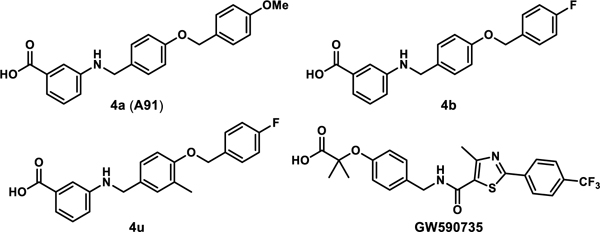
Table 8.
Thermodynamic Binding Profiles of Selected Ligands with the Ligand Binding Domain of PPARα.a
 | |||||
|---|---|---|---|---|---|
| Compound | EC50 (μM) | Kd (μM) | ΔG (kcal/mol) |
ΔH (kcal/mol) |
−TΔS (kcal/mol) |
| 4a (A91) | 4.43 ± 0.01 | 16.90 ± 1.50 | −6.50 ± 0.05 | −12.20 ± 1.40 | 5.71 ± 1.31 |
| 4b | 0.77 ± 0.03 | 5.32 ± 0.78 | −7.20 ± 0.09 | −8.18 ± 0.20 | 0.98 ± 0.27 |
| 4u | 0.037±0.005 | 0.14 ± 0.05 | −9.39 ± 0.17 | −7.75 ± 0.26 | −1.65 ± 0.37 |
| GW590735 | 0.015 ± 0.002 | 0.17 ± 0.03 | −9.24 ± 0.09 | −14.10 ± 0.50 | 4.90 ± 0.50 |
Buffer: 20 mM Hepes, 150 mM NaCl, pH 7.4. Ligand solution: 200–1000 μM ligand in buffer with 0.8–10% DMSO. Protein solution: 30–85 μM PPARα LBD in buffer with same concentration of DMSO as corresponding ligand solution. Thermodynamic parameters reported as mean ± S.D. of at least three separate experiments. All experiments were performed at 25 °C. N.D. = not determined.
