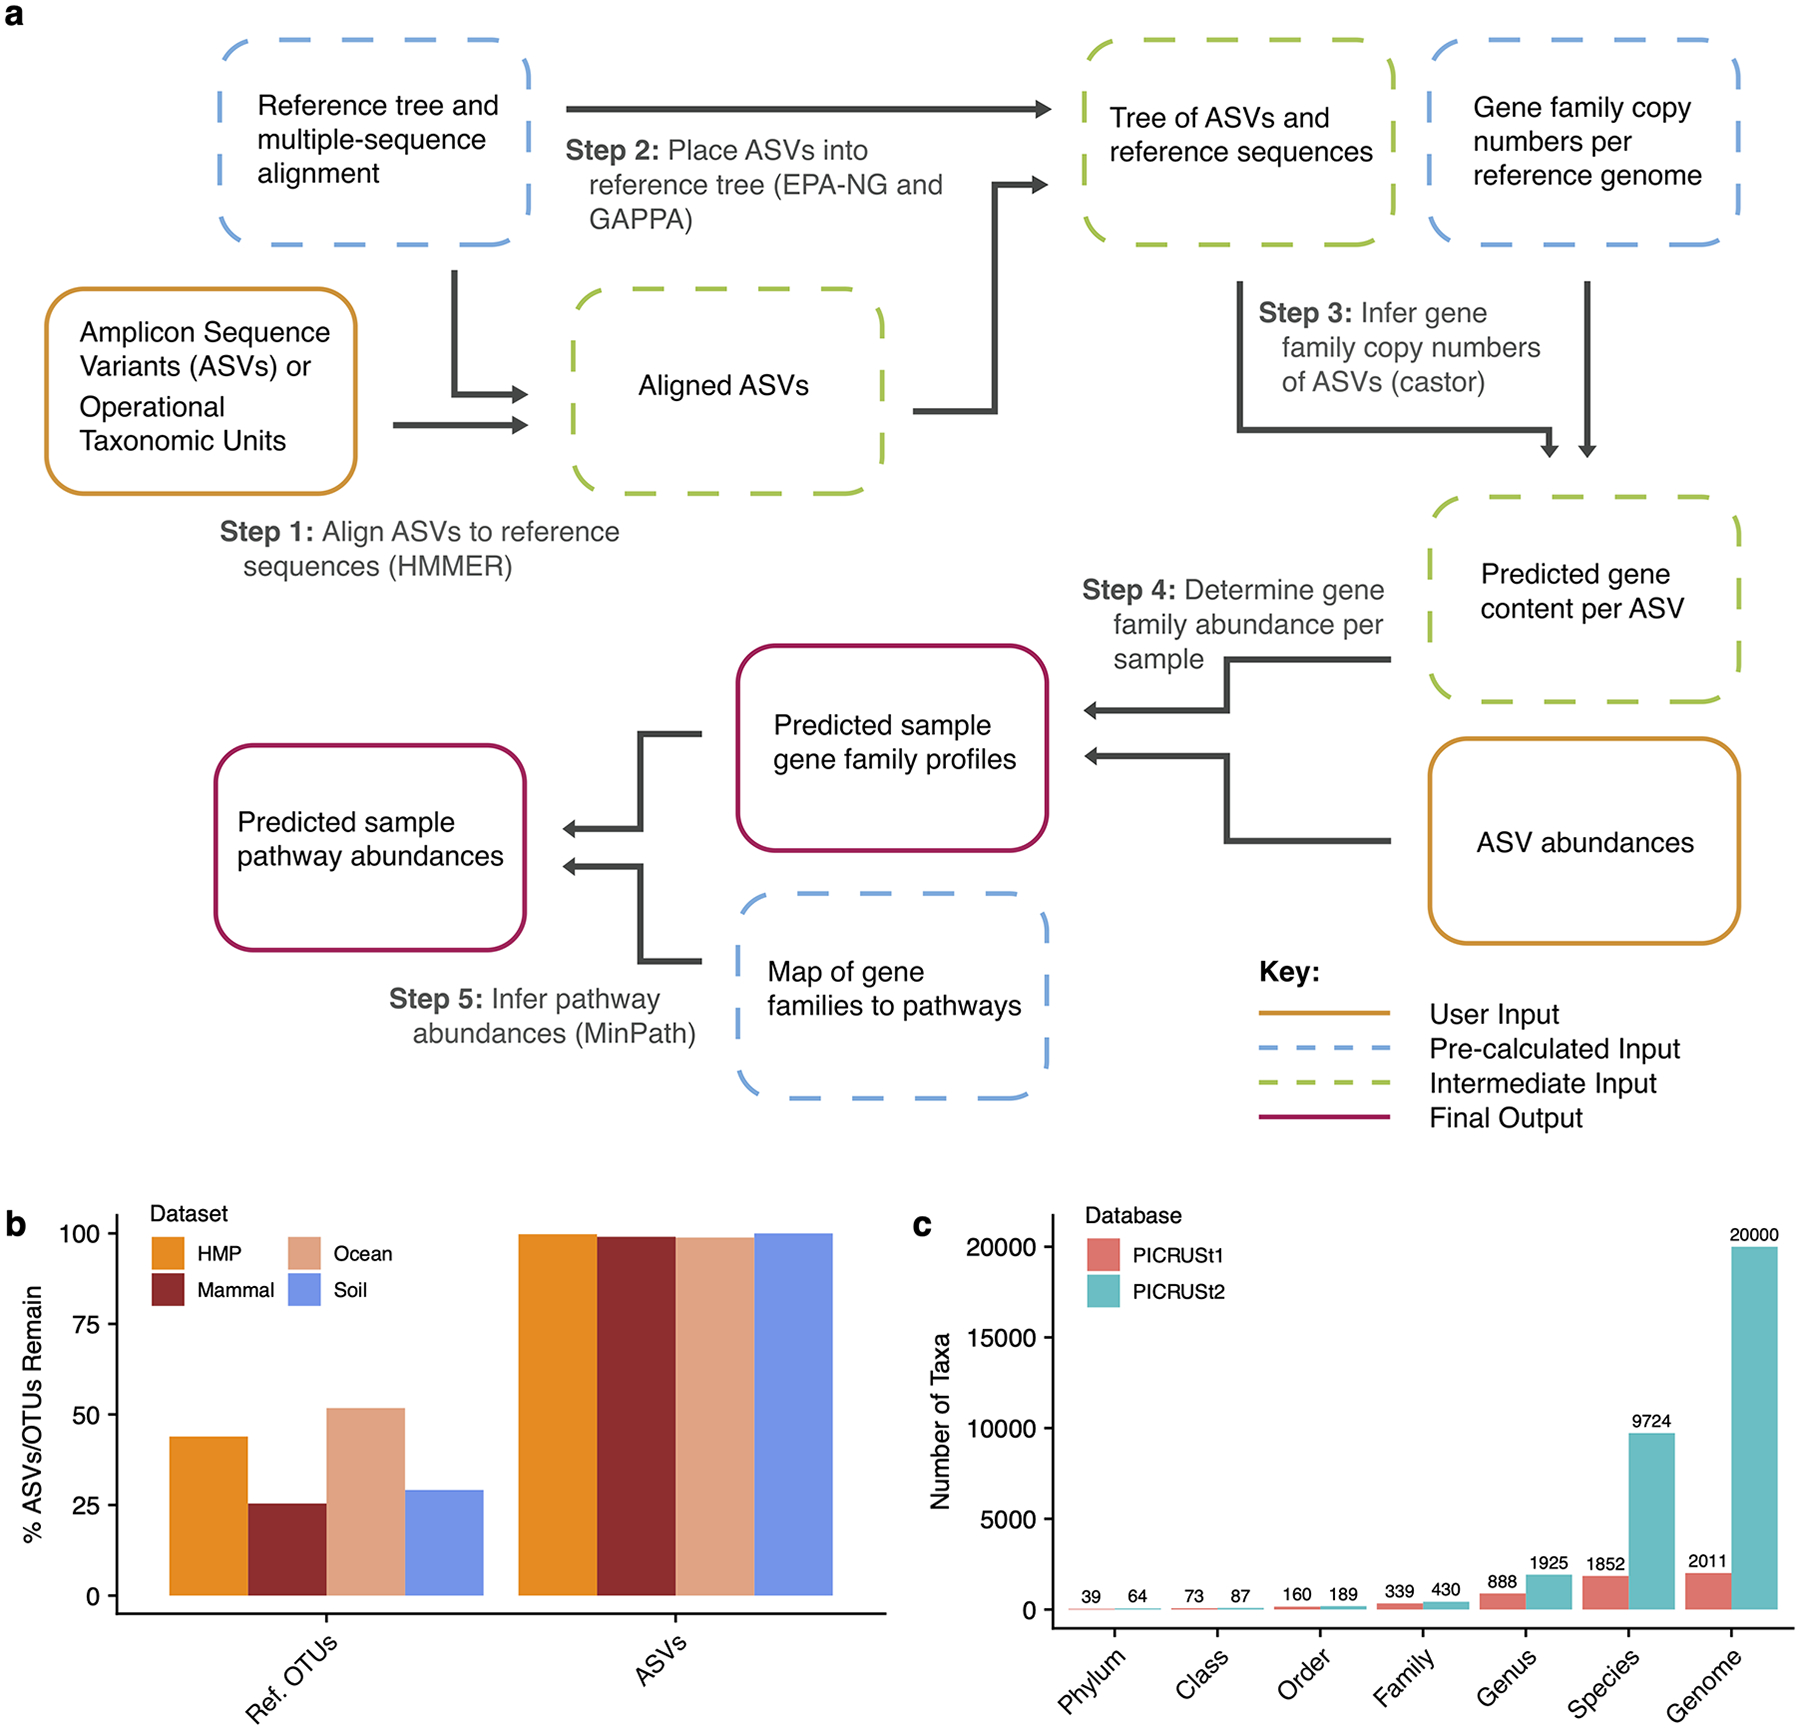
Figure 1: PICRUSt2 algorithm.

(a) The PICRUSt2 method consists of phylogenetic placement, hidden-state-prediction and sample-wise gene and pathway abundance tabulation. ASV sequences and abundances are taken as input, and gene family and pathway abundances are output. All necessary reference tree and trait databases for the default workflow are included in the PICRUSt2 implementation. (b) The default PICRUSt1 pipeline restricted predictions to reference operational taxonomic units (Ref. OTUs) in the Greengenes database. This requirement resulted in the exclusion of many study sequences across four representative 16S rRNA gene sequencing datasets. PICRUSt2 relaxes this requirement and is agnostic to whether the input sequences are within a reference or not, which results in almost all of the input amplicon sequence variants (ASVs) being retained in the final output. (c) An increase in the taxonomic diversity in the default PICRUSt2 database is observed compared to PICRUSt1.
