
Figure 4.
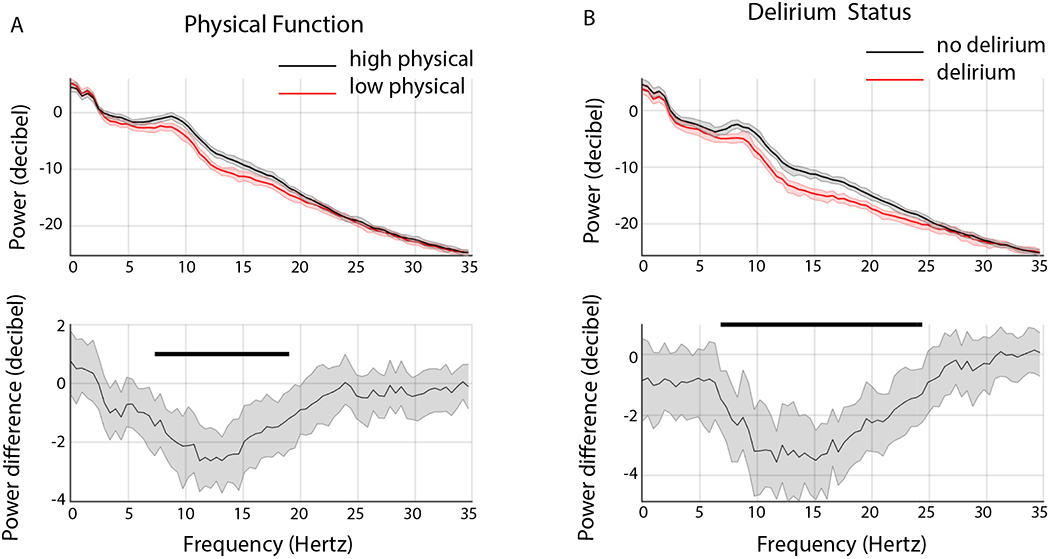
Group level spectra. A. Power spectra of high physical function (black) versus low physical function (red) groups (top panel). Electroencephalogram power was significantly greater in the high physical function group between 7.3 to 19 Hz (bottom panel, bootstrap difference of mean). B. Power spectra of no delirium (black) versus delirium (red) groups (top panel). Electroencephalogram power was significantly greater in the no delirium group between 6.8 to 24.4 Hz (bottom panel, bootstrap difference of mean).
Median bootstrapped spectra presented with 99% confidence intervals. Horizontal solid black lines represent significantly different frequencies.