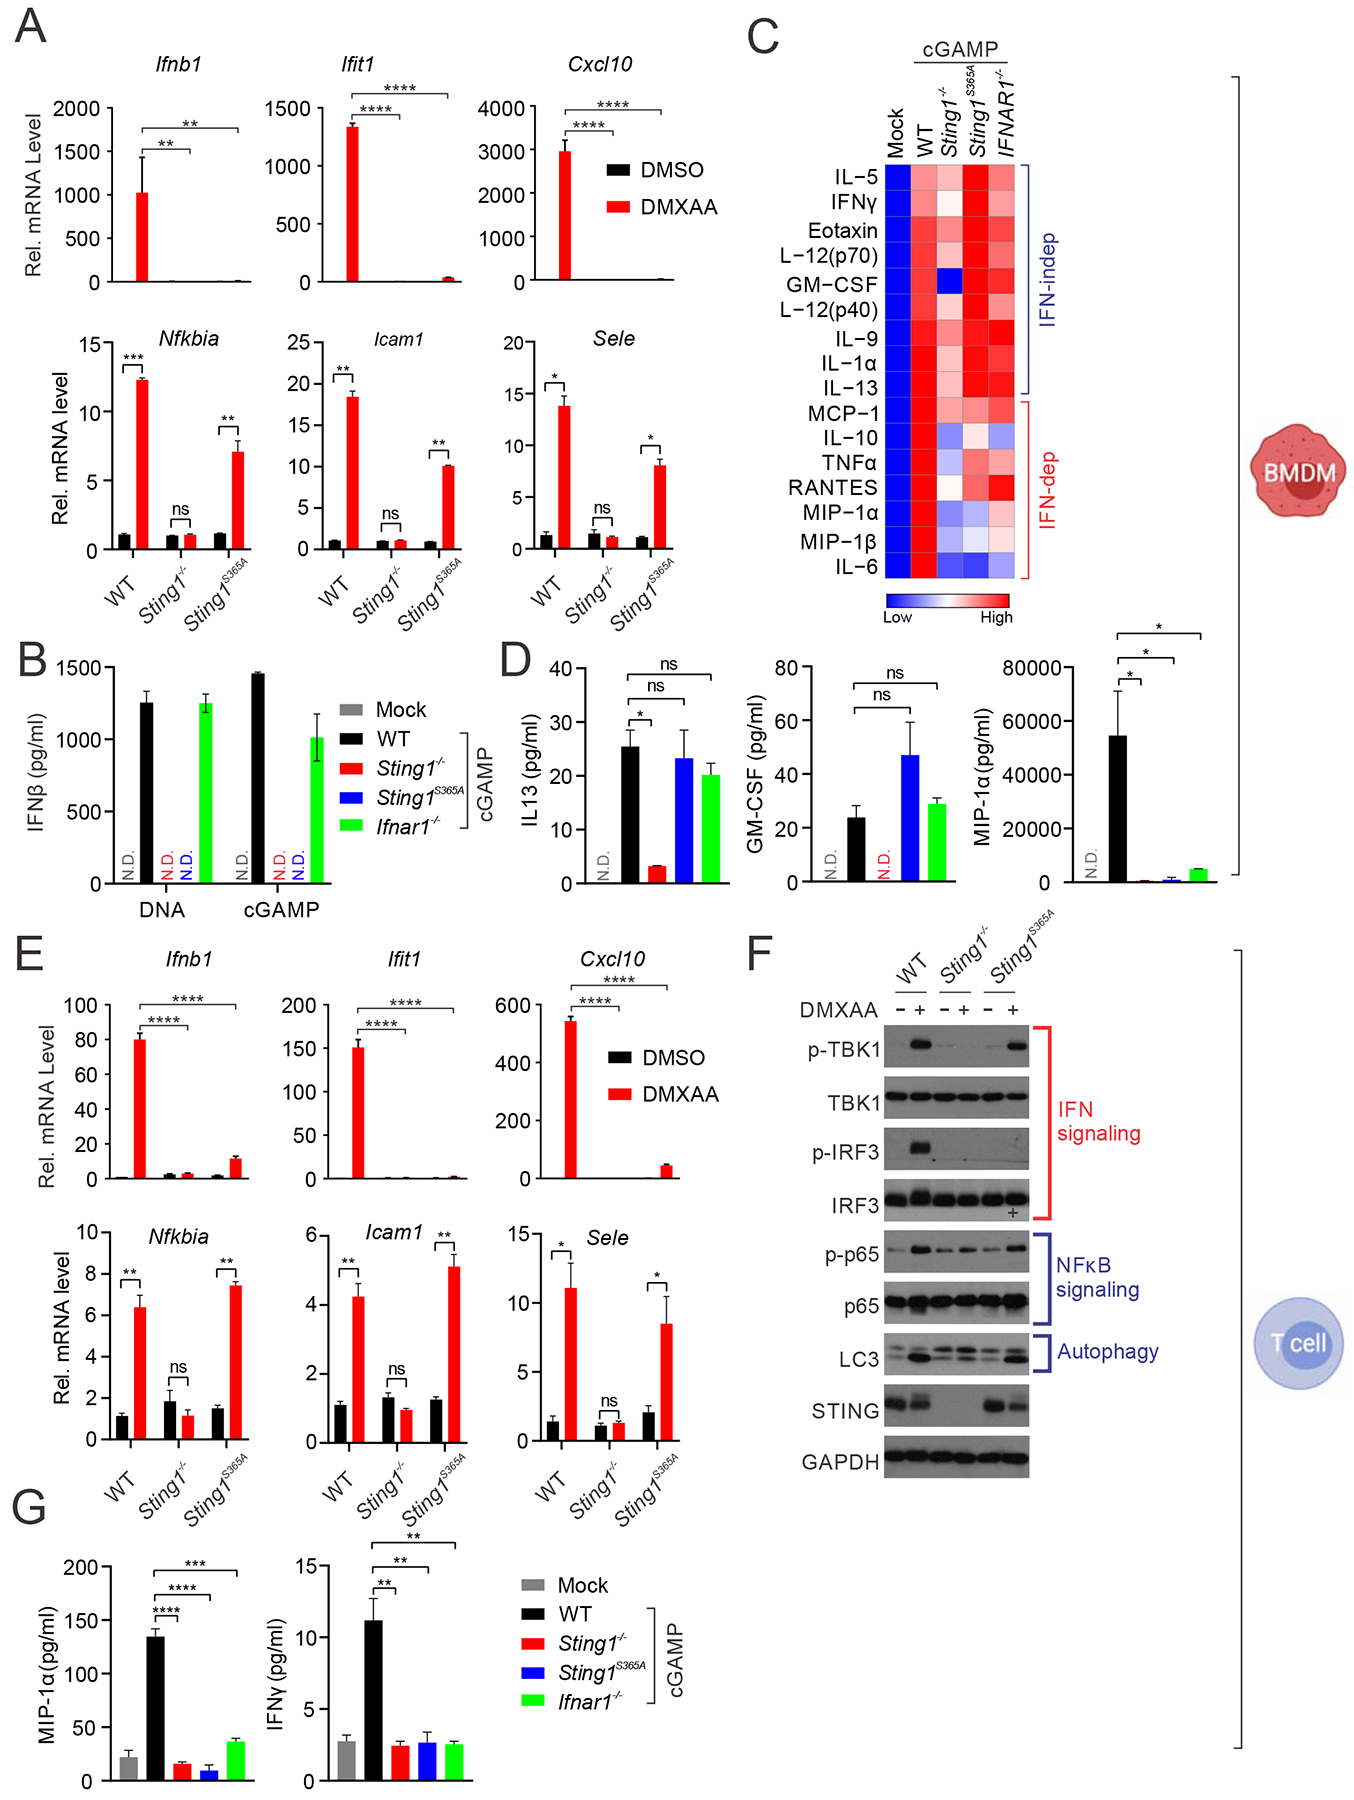
Figure 1: Sting-S365A mutation specifically abrogates IFN signaling.

(A) Quantitative RT-PCR analysis of IFN- and NFκB-stimulated genes in BMDMs from WT, Sting1−/− or Sting1S365A/S365A mice (Sting1S365A, same throughout). Cells were stimulated with DMXAA (10 μg/ml) for 5 h in vitro followed by qRT-PCR analysis of indicated mRNA (on top). **, p < 0.01; ***, p < 0.001; and ****, p < 0.0001. Error bars, SEM. Two-way ANOVA test.
(B) ELISA analysis of IFNβ production in BMDMs stimulated with DNA or 2’3’-cGAMP (cGAMP below) for 24 h.
(C, D) Cytokine array analysis of BMDMs stimulated with cGAMP for 24 h. A heatmap summarizing all the data is showing in C. Representative cytokines are showing in D.
(E) Quantitative RT-PCR analysis of IFN or NFκB-stimulated gene expression in T cell. Cells were stimulated with DMXAA (2 μg/ml) for 5 h followed by qRT-PCR analysis of indicated mRNAs (on top). **, p < 0.01; ***, p < 0.001; and ****, p < 0.0001. Error bars, SEM. Two-way ANOVA test.
(F) Immunoblot analysis of signaling pathways activated by STING. Splenic T cells were stimulated with DMXAA (10 μg/ml) for 6 h in vitro. Cell lysates were analyzed for proteins indicated on the left. Known signaling pathways are indicated on the right.
(G) Cytokine protein levels in T cells of indicated genotype after cGAMP stimulation.
Data are representative of at least three independent experiments.independent experiments.
See also Figure S1.
