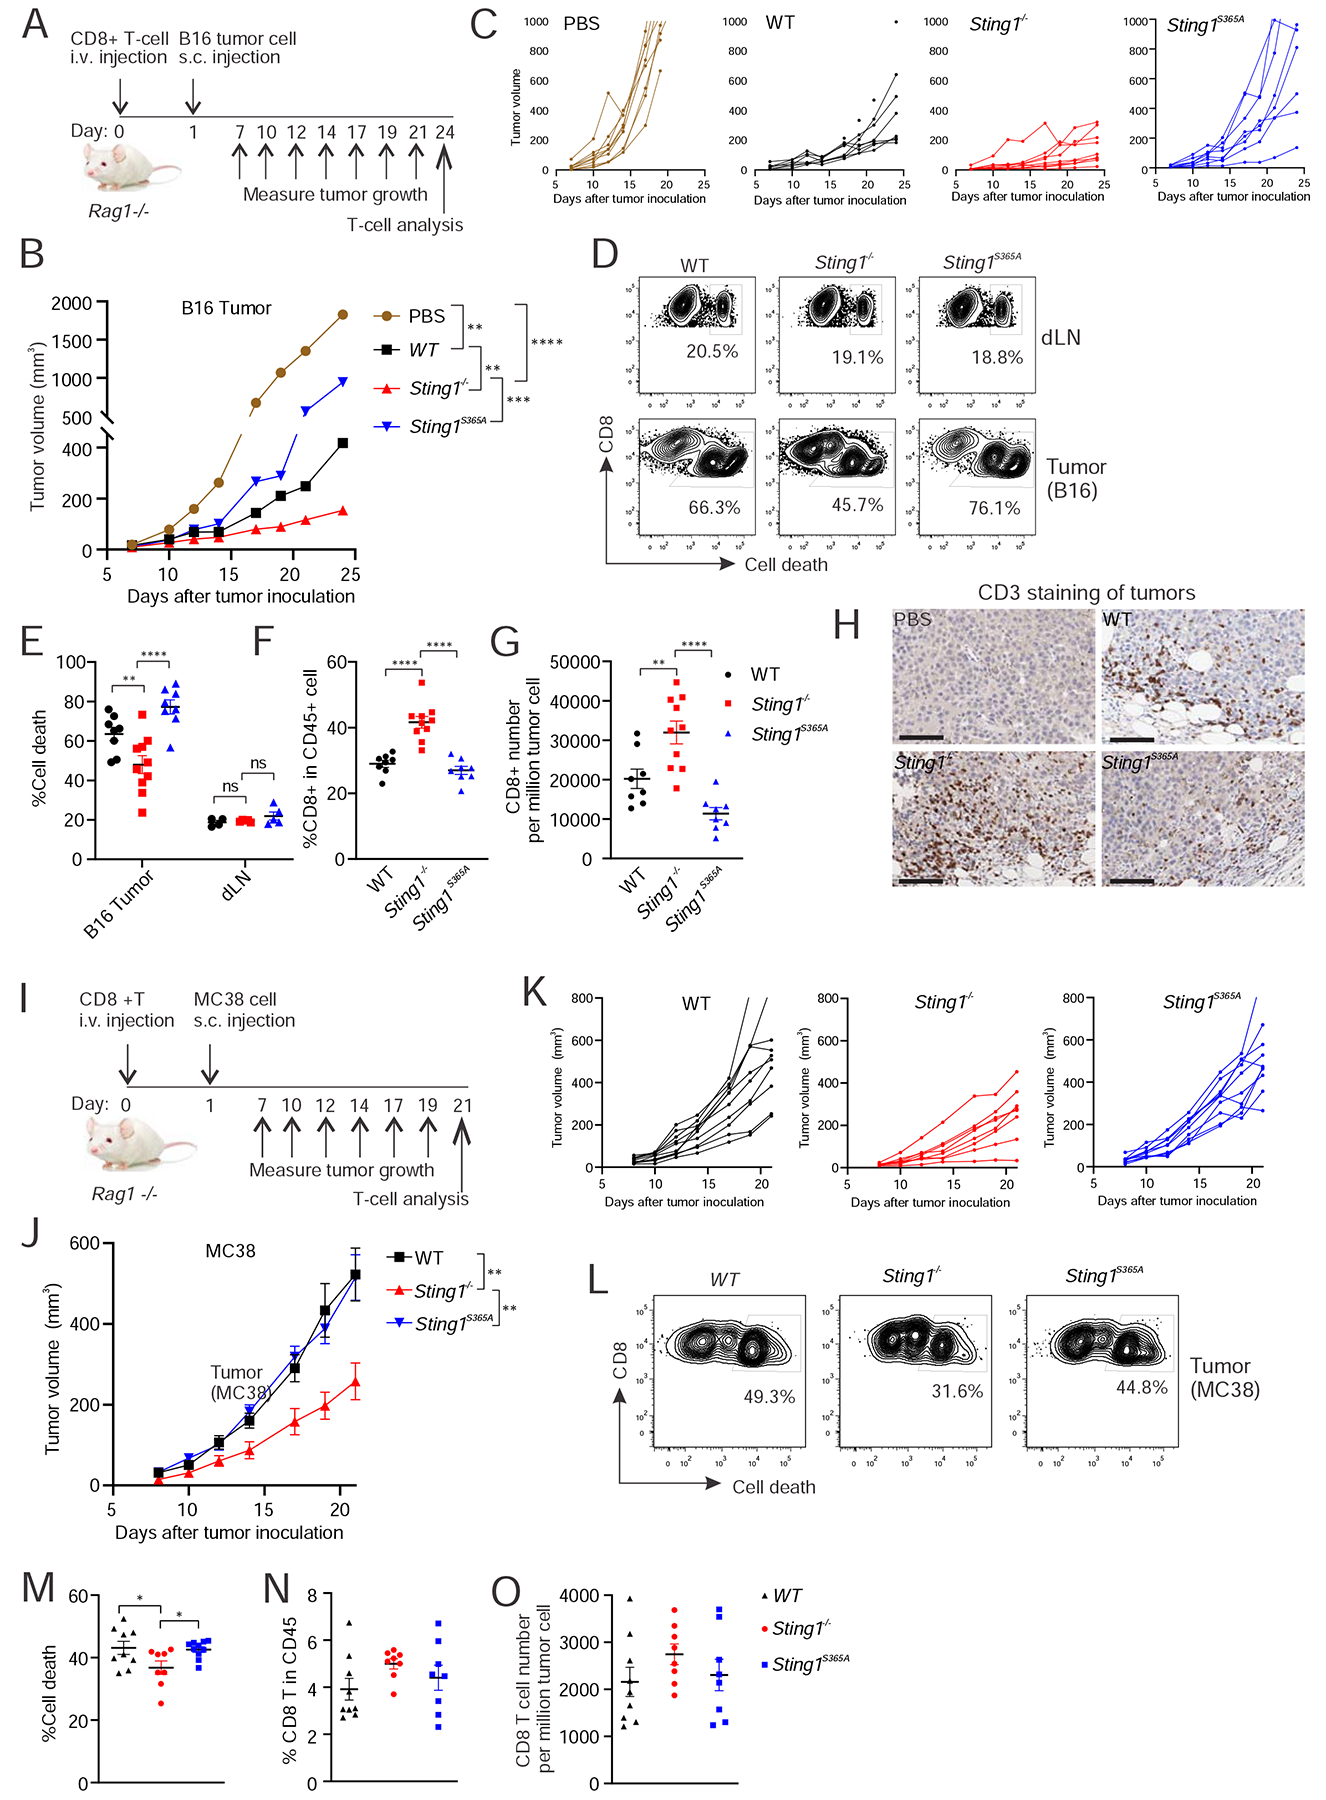
Figure 5. Tumor induces STING-mediated T cell death to evade immune control in the adoptive transfer T-cell model.

(A) A diagram of the B16 tumor experiment in C-H (also see STAR Methods). n=8–10. B and C, B16 tumor growth curves in Rag1−/− mice adoptively transferred with CD8+ T cell of indicated genotype. Average growth curve (B) and individual tumor growth curves (C) are shown. D-G, FACS analysis of T cells in the tumor and draining lymph node (dLN). Single cell suspension from B16 tumor or dLN were stained with cell death marker and T cell surface antibody followed by FACS analysis (see STAR Method). Gating strategy are shown in Figure S6A. Representative FACS plots are shown in D. Dot plots are shown for percentage of CD8+ T cell death (E), percentage of CD8+ T cells in CD45+ population (F) and number of CD8+ T cells in tumor (G). H, immunohistochemistry analysis of T cells (CD3 staining) in tumor. Scale bar, 100 μm. (I) A diagram of the MC38 tumor experiment in J-O. n=8. J and K, MC38 tumor growth curves in Rag1−/− mice adoptively transferred with CD8+ T cell of indicated genotype. Average growth curve (J) and individual tumor growth curves (K) are shown. L-O, FACS analysis of T cells in the tumor. Single cell suspension from MC38 tumor were stained with cell death marker and T cell surface antibody followed by FACS analysis. Representative FACS plots are shown in L. Dot plots are shown for percentage of CD8+ T cell death in tumor (M), percentage of CD8+ T cells in CD45+ population (N) and number of CD8+ T cells in tumor (O). *, p < 0.05; **, p < 0.01; ***, p < 0.001, ****, p < 0.0001. ns, not significant. Error bars, SEM. Two-way ANOVA test.
Data are reprehensive of at least three independent experiments.
See also Figure S6.
