FIGURE 2.
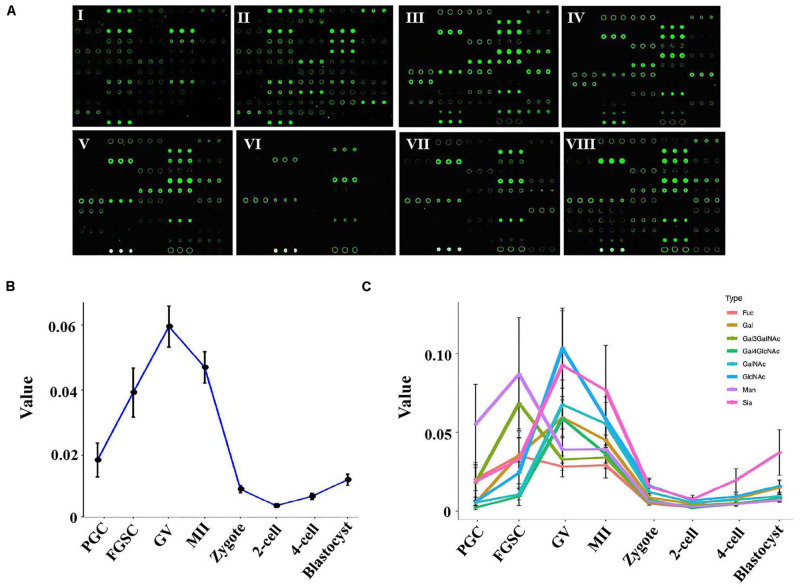
Glycosylation patterns of glycoproteins in female germ cells and preimplantation embryos. (A) Representative lectin microarray fluorescence images of mouse female germ cells and preimplantation embryos at different developmental stages. I: PGC; II: FGSC; III: GV oocyte; IV: MII oocyte; V: zygote; VI: 2-cell stage embryo; VII: 4-cell stage embryo; VIII: blastocyst. (B) Average lectin signal intensity in the developing female germ cells and preimplantation embryos. (C) Average signal intensities of different types of lectins in oogenesis and preimplantation embryos.

