
Figure 2.
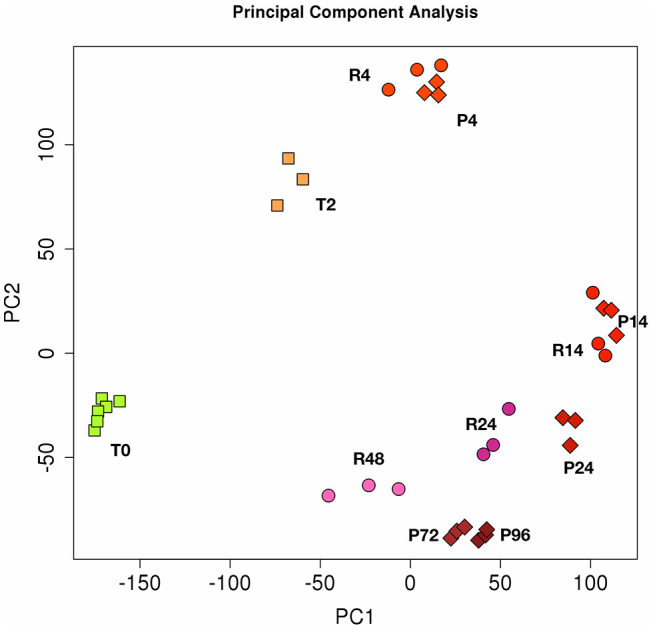
Principal component analysis (PCA) of gene expression in resolving and persistent inflammatory models. Each dot represents a sample. Six samples (monocytes from 6 different donors) were analysed at time 0 (T0) and three after 2 h with CCL2 (T2). Three samples were examined for each time point of the two models after sequential stimulations as described in the Figures 1A,B (3 donors for the resolving model, R; and 3 donors for the persistent model, P). Numbers represent the time points: 4, 14, 24, and 48 h for resolving inflammation; 4, 14, 24, 72, and 96 h for persistent inflammation. The samples cluster in different areas from left to right, based on the time points of stimulation, which correspond to different phases of inflammatory reactions.