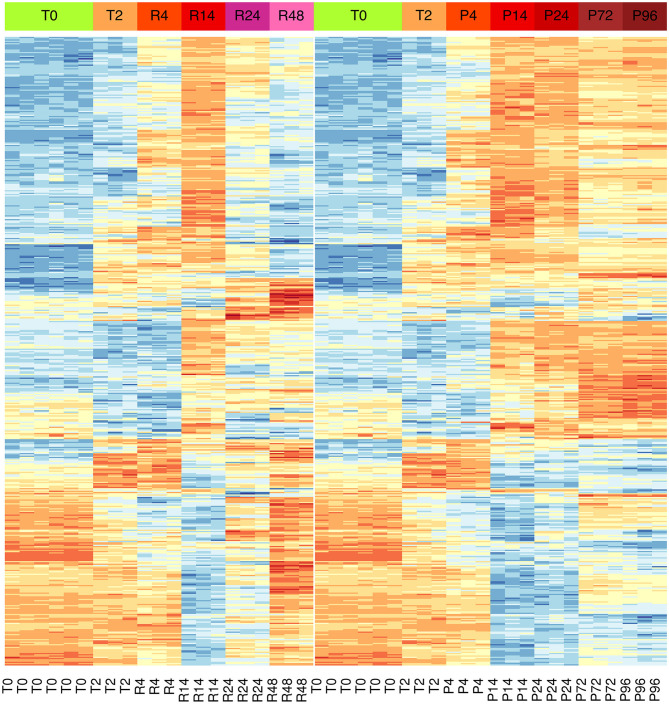
Figure 3.
Differential gene expression during the inflammation phases of the resolving and persistent inflammatory models. Heat-maps of the 500 genes with the most significant expression differences (limma moderated F-statistics, FDR < 0.05) between the two models at any time point (Supplementary Table 3). Left: resolving inflammation model; right: persistent inflammation model. The gene clusters show that the two models are very similar from 0 to 14 h, but they begin to diverge from 14 to 24 h. Colors represent gene expression (gene-wise z-score); blue: low; red: high.

