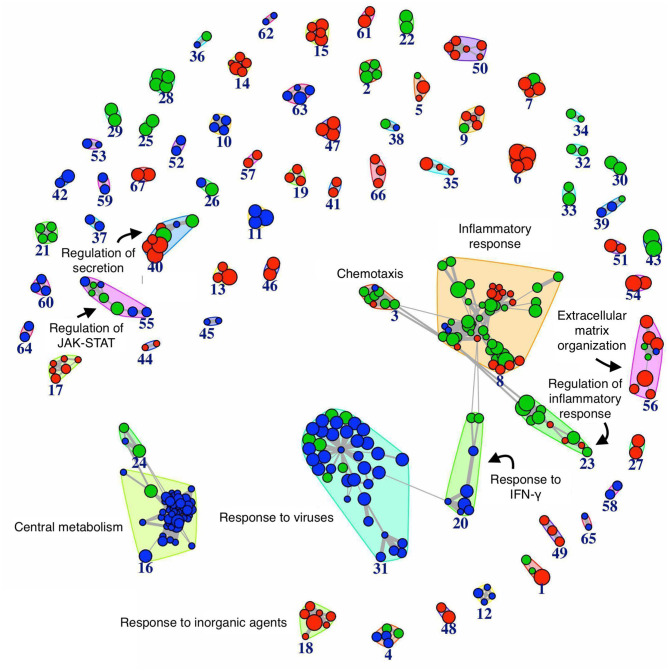
Figure 4.
Network of biological pathways enriched in differentially expressed genes between resolving and persistent inflammation. Network of pathways significantly enriched (see Materials and Methods) in genes differentially expressed between the two models at 24 h, and between resolving inflammation at 48 h (R48) and persistent inflammation at 96 h (P96). The bigger the circle, the higher the number of genes in the pathway. Circle colors reflect pathway occurrence among the top 500 pathways at 24 h only (blue), between P96 vs. R48 (red), or both (green). Links are reported only between any pathway pair (X, Y) with overlap coefficient . See Supplementary Tables 4, 5.

