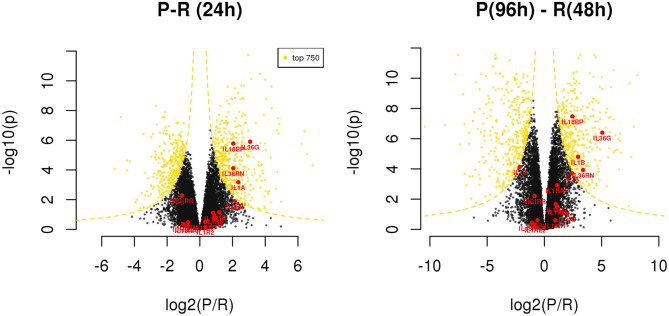
Figure 5.
Differentially expressed genes between resolving and persistent models. For each comparison, genes are reported on considering BH adjusted P-value (y axis) and log2 fold change (x axis); the yellow dotted lines depict the hyperboles that separate the top 750 genes (yellow points) ranked by s score (see Materials and Methods), i.e., the product between the quantities reported on the two axes. See Supplementary Table 6.

