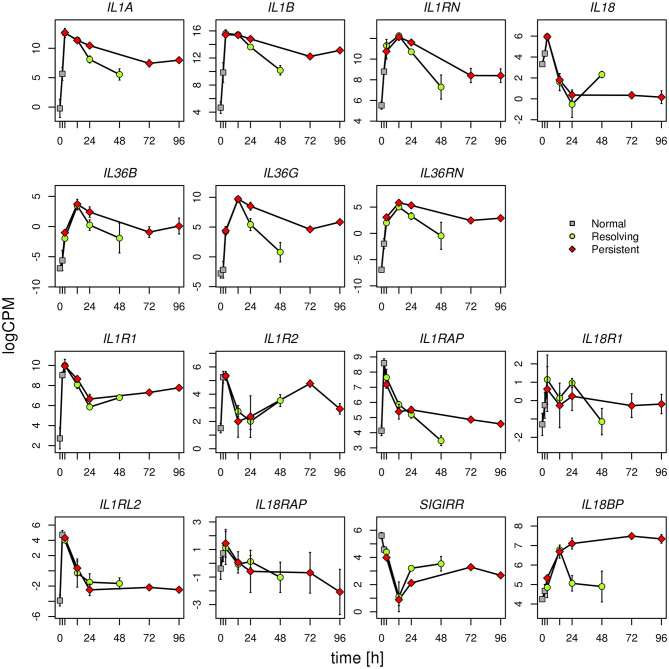
Figure 6.
Gene expression profiles of IL-1 family cytokines and receptors. Expression levels of the genes of IL-1 family during the resolving and persistent inflammatory reactions. The mean expression values from three different donors for each model are reported.
logCPM: log count per million. Bars indicate standard deviation across biological replicates.
Statistically significant differences are as follows (R = resolving; P = persistent):
IL1A R24 vs. P24 P < 0.001; R48 vs. P96 P < 0.0001
IL1B R48 vs. P96 P < 0.0001
IL18 R48 vs. P96 P < 0.0001
IL36B R24 vs. P24 P < 0.05
IL36G R24 vs. P24 P < 0.0001; R48 vs. P96 P < 0.0001
IL36RN R24 vs. P24 P < 0.0001; R48 vs. P96 P < 0.001
IL1RAP R48 vs. P96 P < 0.05
SIGIRR R24 vs. P24 P < 0.05; R48 vs. P96 P < 0.05
IL18BP R24 vs. P24 P < 0.0001; R48 vs. P96 P < 0.0001
All other differences have a P > 0.05.

