
. 2020 Jul 10;11:1035. doi: 10.3389/fphar.2020.01035
Copyright © 2020 Wang, Gao, Lu, Li, Zhou, Qin, Du, Gao, Guan and Lu
This is an open-access article distributed under the terms of the Creative Commons Attribution License (CC BY). The use, distribution or reproduction in other forums is permitted, provided the original author(s) and the copyright owner(s) are credited and that the original publication in this journal is cited, in accordance with accepted academic practice. No use, distribution or reproduction is permitted which does not comply with these terms.
Figure 2.
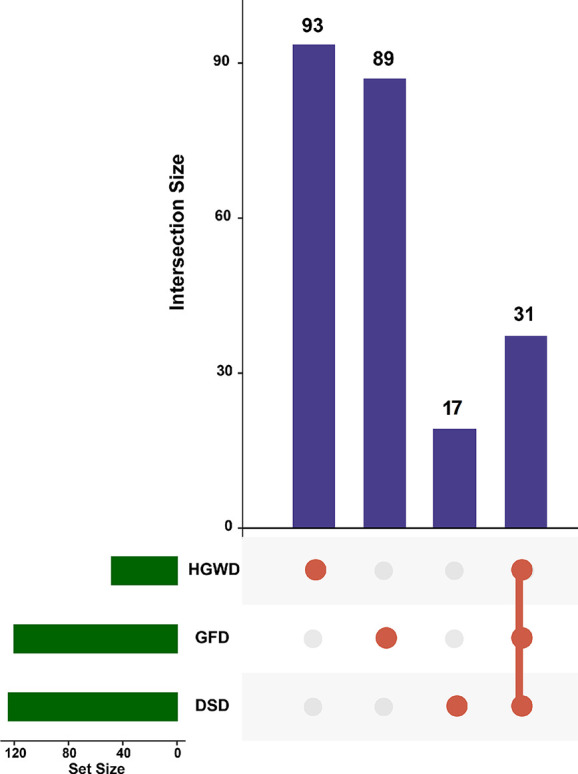
Distribution map of active components in DSD, GFD, and HGWD.