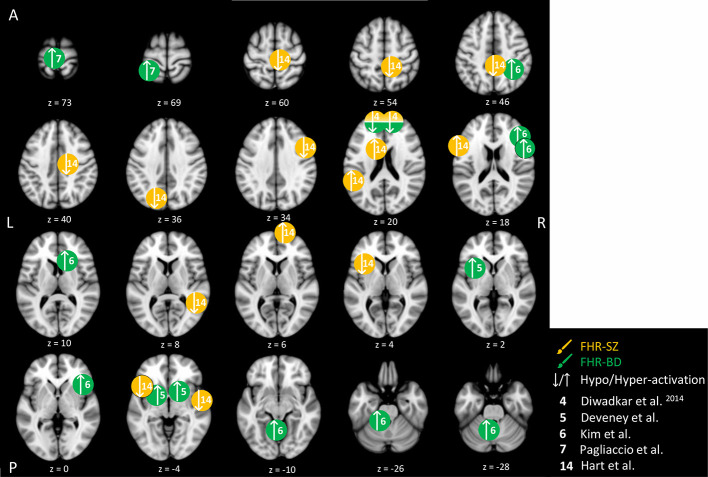
Figure 3.
Cognitive control-related brain activity differences between children and adolescents at familial high-risk (FHR) for schizophrenia (SZ) and healthy control (yellow circles), and for bipolar disorder (BD) and healthy control (HC, green circles). Circles mark the peak coordinate activation difference but do not reflect the extend of activation. The coordinates of peak activation reported in Talairach space were translated to Montreal Neurologic Institute (MNI) coordinates using the MNI<->Talairach with Brodmann Areas (1.09) website (http://sprout022.sprout.yale.edu/mni2tal/mni2tal.html). Using FSLview (version 4.0.1 ©2004-2009 Oxford University), the reported peak coordinates in each article were entered to localize brain area on a standard MNI152 brain. For visualization of areas of peak activation differences between FHR-SZ, FHR-BD, and HC, we created figures using FSLview and Mango (Version: 4.1, Jack L. Lancaster, Ph.D., Michael J. Martinez © 2019 Research Imaging Institute, UTHS CSA). Exact coordinates and details on contrasts and statistics can be found in Supplementary Table 2 .

