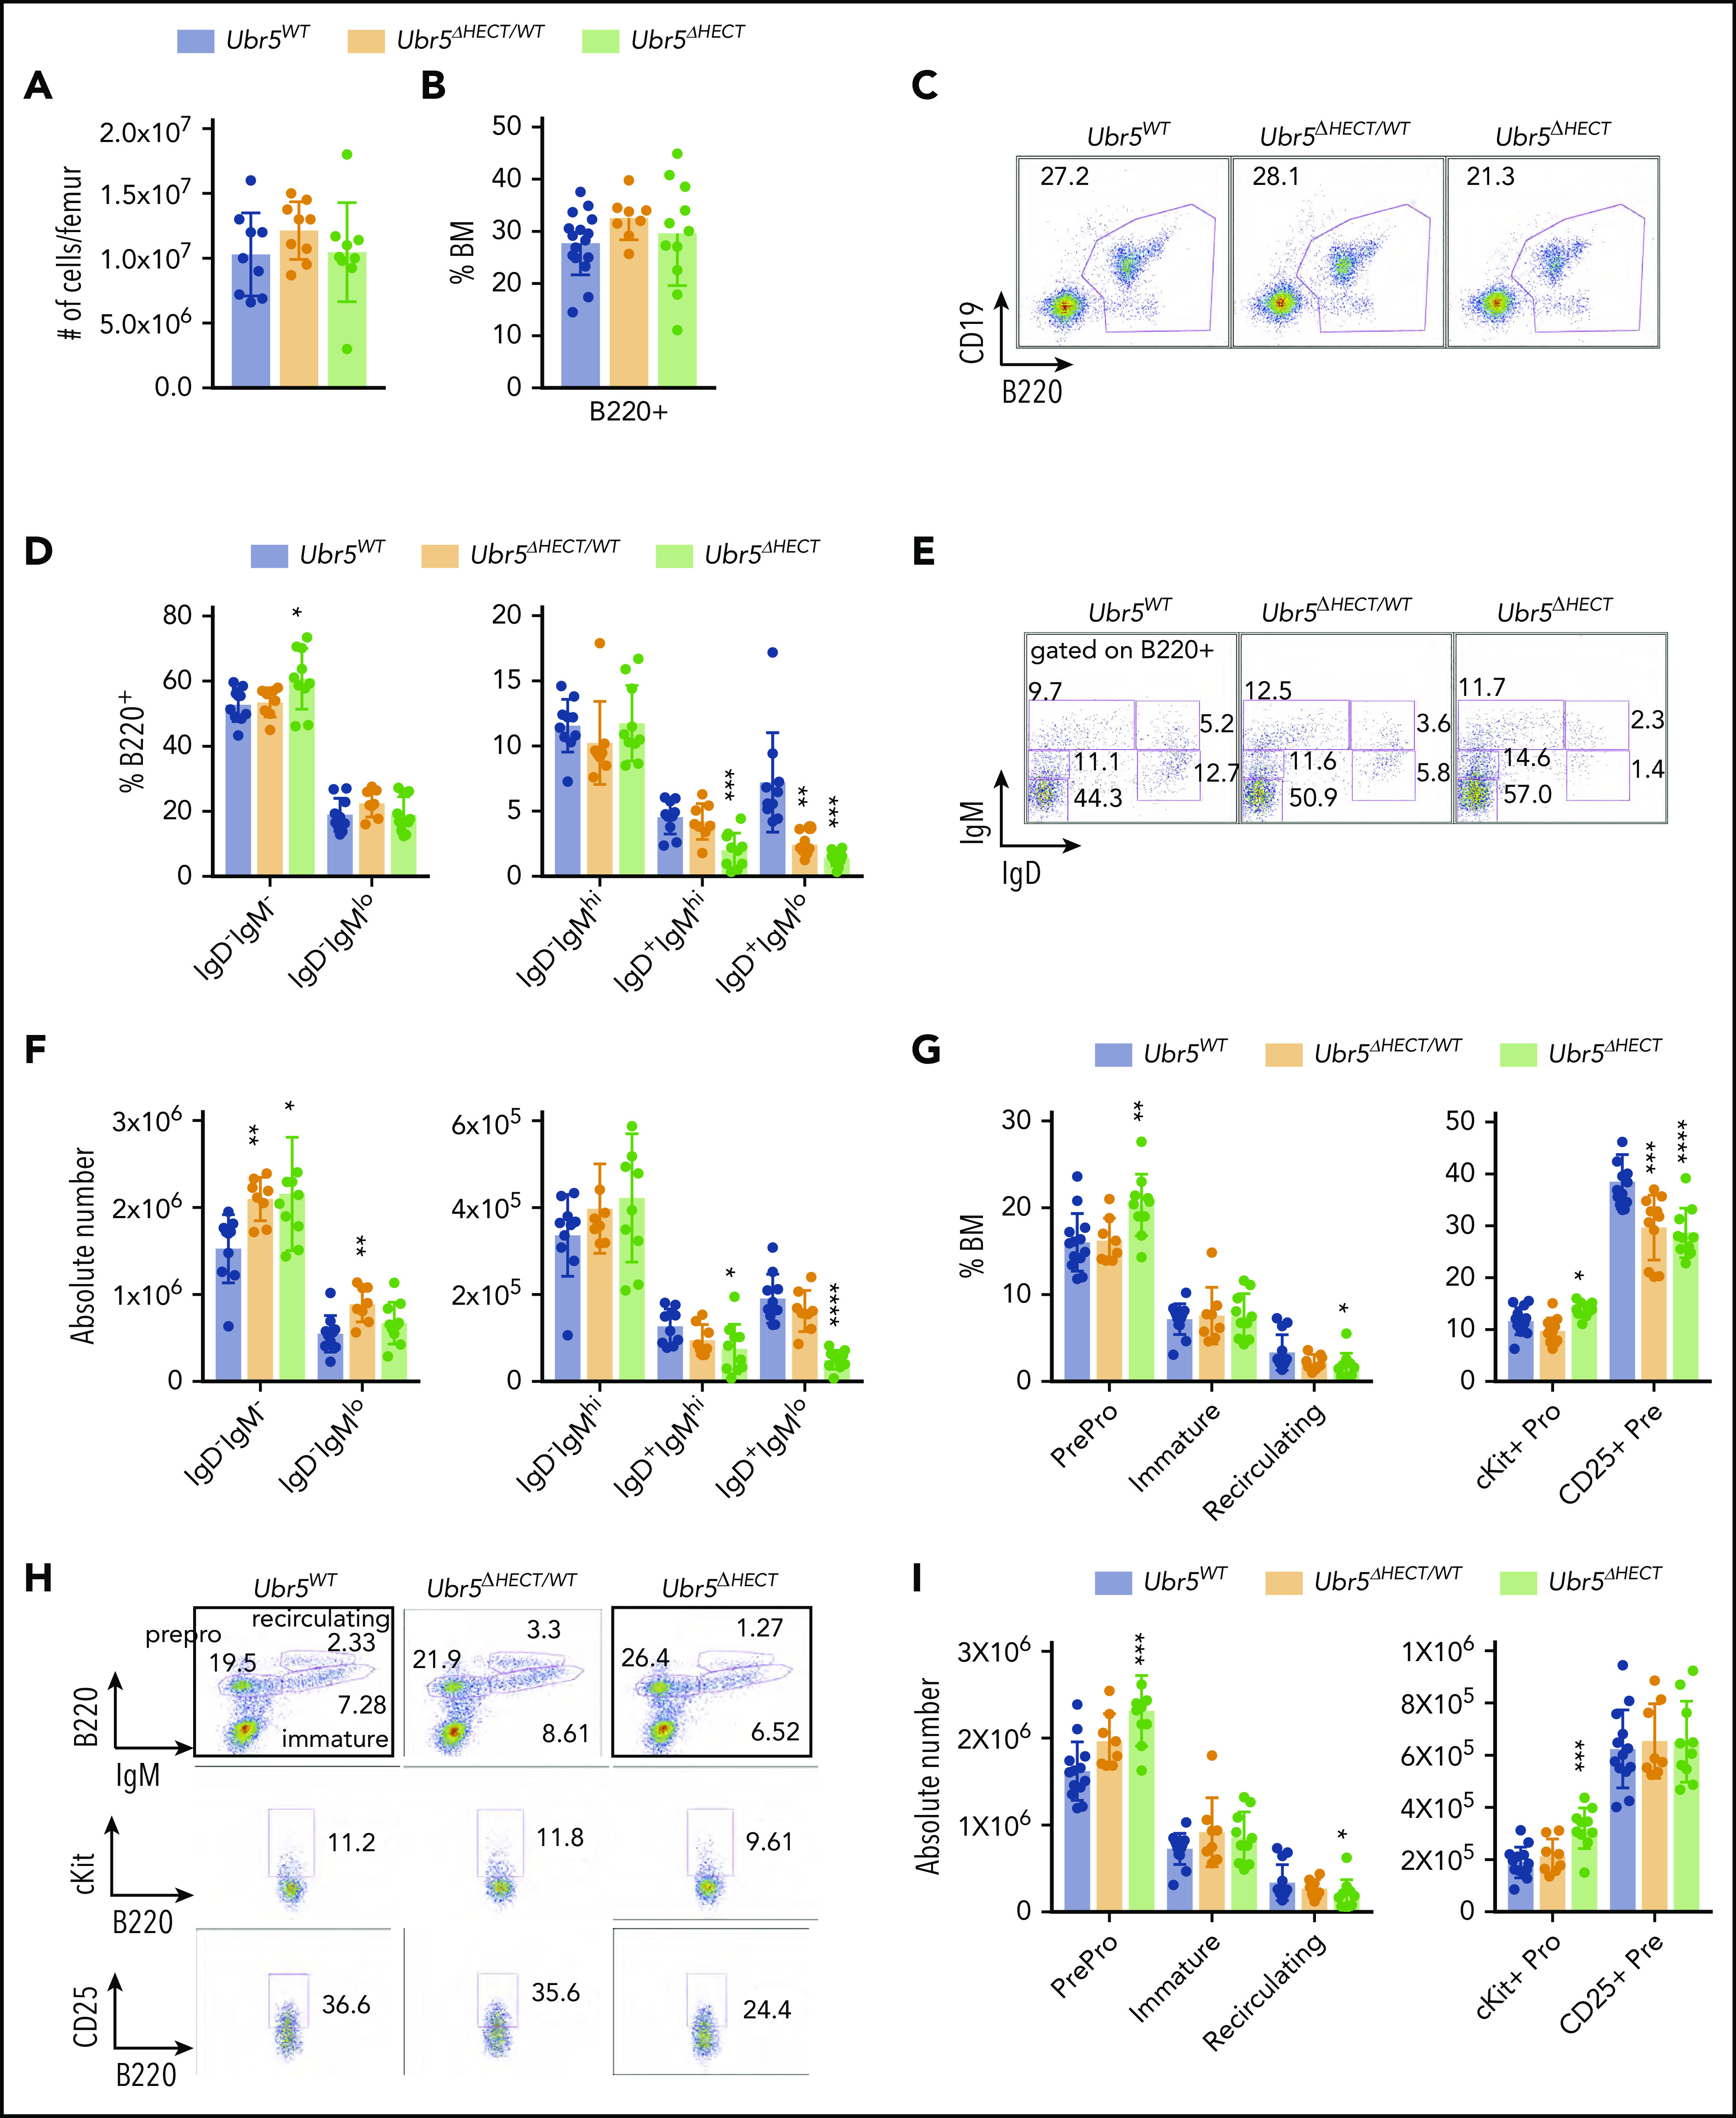
Figure 2.

The loss of the HECT domain of Ubr5 leads to decreased numbers of mature B cells within the BM. (A) Bar graph of the total number of cells per femur. (B) Bar graph of the frequency of B220+ cells in the BM. (C) Representative flow cytometry plot of total B220+ in the BM. (D) Bar graphs of B-cell populations gated on B220+ cells for pro- and pre-B cells (B220+IgM−IgD−), immature B cells (B220+IgMloIgD−), transitional B cells (B220+IgM+IgD−), early mature B cells (B220+IgM+IgD+), and late mature B cells (B220+IgM−IgD+). (E) Representative flow cytometry plots for populations shown in panel D. (F) Absolute number of B-cell populations from panel D. (G) Bar graph of the population breakdown shown in panel H. (H) Representative flow cytometry plots gated for pro- and pre-B cells (B220+IgM−), immature B cells (B220+IgMlo), and recirculating B cells (B220+IgM+) (top). A representative flow cytometry plot gated on B220+ cells gating for pro-B cells (B220+IgM−c-kit+) (middle) and pre-B cells (B220+IgM−CD25+) (bottom). (I) Absolute number of B-cell populations from G (N = 10). *P < .05, **P < .01, ***P < .001.
