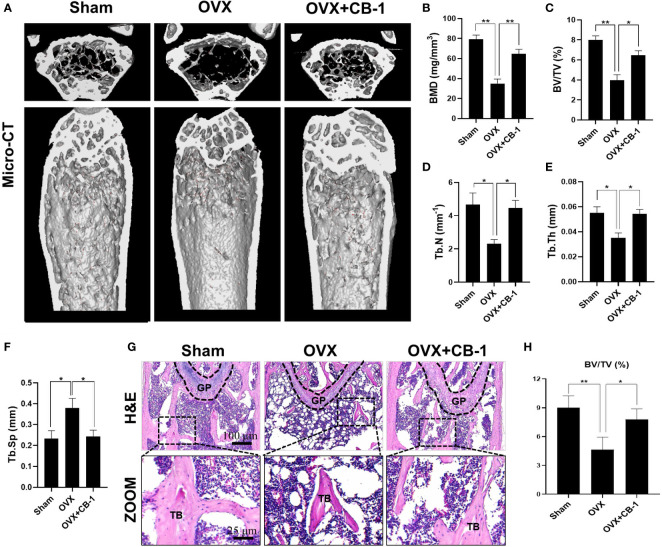
Figure 5.
CB-1 inhibited ovariectomized induced bone loss. (A) Micro-CT reconstruction images, (B) Bone mineral density (BMD, mg/cm3), (C) Bone volume/tissue volume (BV/TV, %), (D) Trabecular number (Tb.N, 1/mm), (E) Trabecular thickness (Tb.Th, mm), (F) Trabecular separation (Tb.Sp, mm). (G) Representative images of H&E staining of decalcified bone sections (n = 5 per group). (H) Quantitative analyses of BV/TV in tissue sections (n = 3 per group). *p < 0.05, **p < 0.01 compared with the OVX group. GP, growth plate; TB, trabecular bone.

