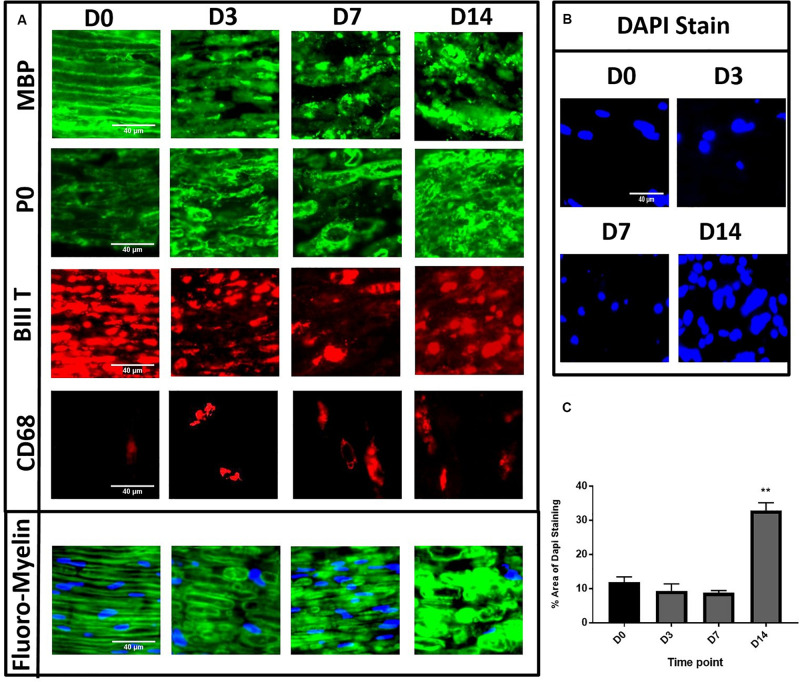
FIGURE 2.
Immunohistochemistry of in vitro model of degeneration showing degenerative changes to both myelin lipids, myelin proteins and axons. Panel (A) showed MBP/βIIIT/P0 staining with evident degeneration at D14 and Fluoro-Myelin staining with lipid degeneration. (D0) Compact homogenous organised myelin and axons resembling normal nerve. (D3) Loosening and disorganisation of myelin with multiple discontinuity. (D7) Continued loosening and disorganisation with greater disruption of myelin structure. (D14) Consolidated mass with loss of architecture. CD68 staining with gradual increase in numbers of cells after degeneration induction. (B,C) Gradual increase of % area of DAPI staining in desheathed explants at different time points showing significant increase at D14. (D0 is control.) (**P < 0.001) Scale bar for MBP, P0, βIIIT, Fluoro-Myelin and DAPI is 40 μm. Scale bar for CD68 is 200 μm.

