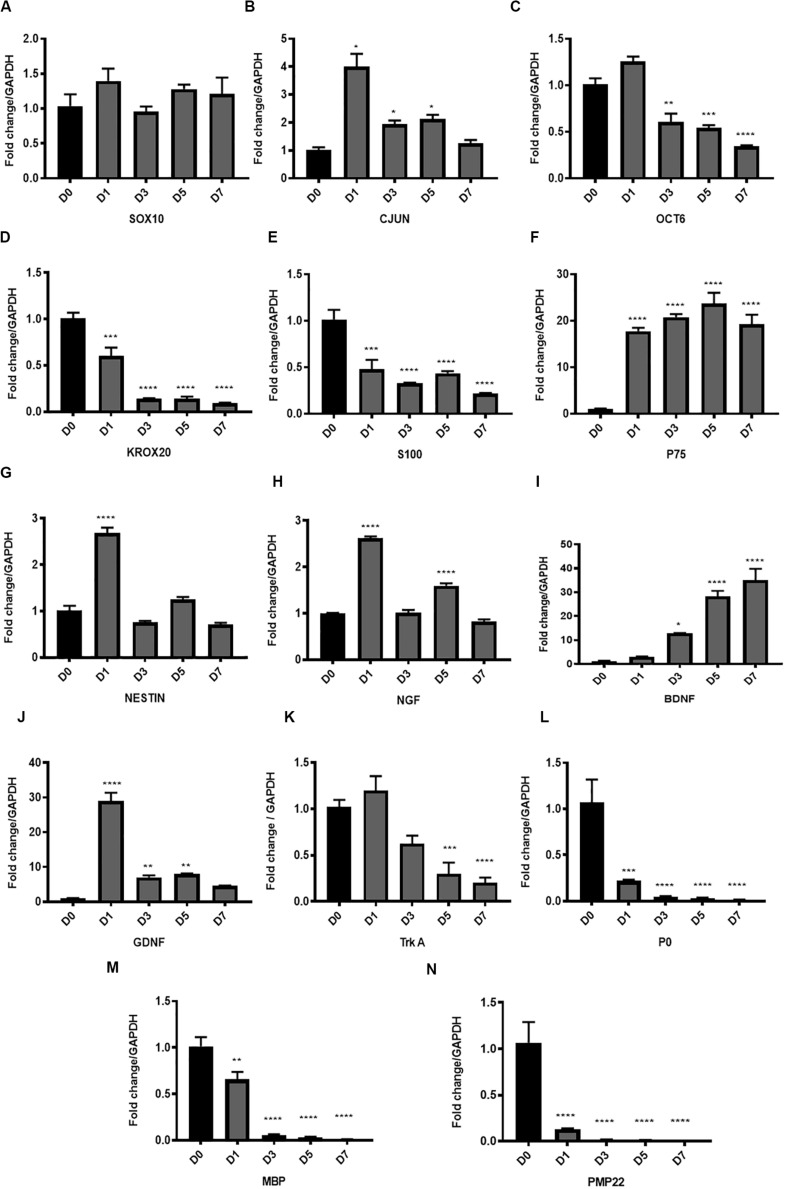
FIGURE 3.
Gene expression of key transcription factors, Schwann cell markers, myelin proteins and neurotrophic factors in the in vitro model of Wallerian degeneration. (A) No significant change in Sox10 gene expression levels after in vitro degeneration. (B) Significant upregulation of Cjun transcription factor after injury mostly at D1 compared to D0 healthy nerve with return to baseline levels at D7. (C) Transcription factor Oct 6 expression after WD induction showed significant downregulation at D3, 5 and 7 post transection. (D) Transcription factor Krox20 showed significant progressive downregulation in its expression levels with in vitro degeneration. (E) SC marker S100 after in vitro WD showed significant downregulation relative to D0 (control healthy nerve). (F) P75 after in vitro WD showed significant persistent upregulation. (G) Neuronal marker and intermediate filament Nestin showed transient significant upregulation at D1 post-harvest followed by return to baseline levels at later time points. (H) Expression of Ngf after in vitro WD was biphasic with significant surge of its expression at D1 and D5 compared to D0 healthy nerve. (I) Neurotrophic factor Bdnf showed significant continuous upregulation after in vitro WD in later time points. (J) Neurotrophic factor Gdnf showed significant early upregulation at D1 followed by gradual reduction at D3, 5 and D7 post-harvest. (K) The Ngf receptor Trka showed gradual downregulation of its gene expression in in vitro WD reaching significant reduction at D7 compared to D0 (control healthy nerve). (L) Gene expression of P0 after WD induction showed early significant downregulation relative to D0 (control). (M) Gene expression of Mbp showed early significant downregulation relative to D0 (control). (N) Gene expression of Pmp 22 after WD induction showed significant downregulation relative to D0 (control). Data are expressed as log2 fold change in D1, 3, 5 and 7 relative to D0 healthy nerve control sample. Data is presented as mean ± SEM (error bars) by one-way ANOVA (Tukey’s multiple comparison test) (*P < 0.05, **P < 0.01, ***P < 0.001, ****P < 0.0001).

