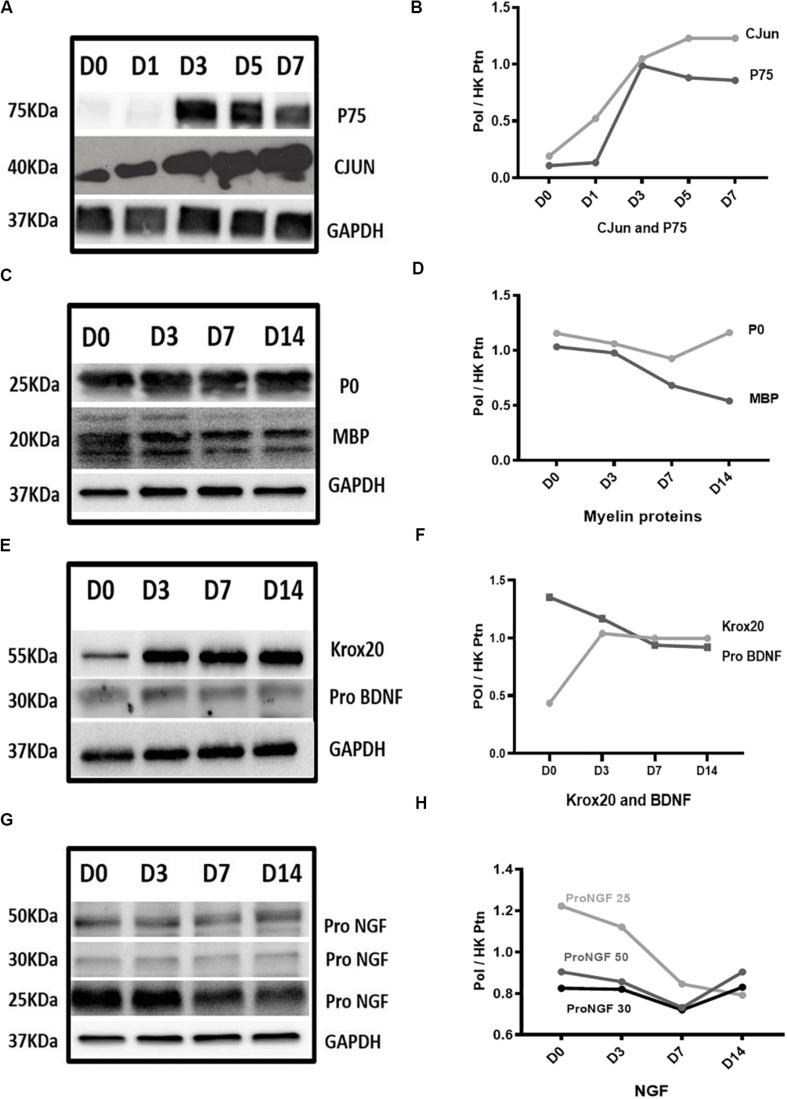
FIGURE 4.
Protein expression results in Wallerian degeneration in vitro model. (A,B) Western blot images and graph, respectively, showed persistent upregulation of CJUN and P75 proteins after WD induction. (C,D) Western blot images and graph, respectively, showed gradual downregulation of MBP protein reaching approximately 50% of its expression at D14 and P0 remained constant throughout the 14 days of in vitro WD compared to D0 healthy nerve. (E,F) Western blot images and graph, respectively, showed upregulation of KROX20 protein at D3 post-degeneration reaching a plateau which remained constant until D14 post-degeneration. PRO-BDNF protein expression showed gradual downregulation starting from D3 post-regeneration and reaching 60% of expression at D14 compared to D0 control. (G,H) Western blot graph and image of PRO-NGF, respectively, showed gradual reduction of different isoforms gradually reaching almost the same level at D14. Data is normalised by GAPDH for each time point. (PoI) is Protein of Interest. (HK ptn) is house-keeping protein.

