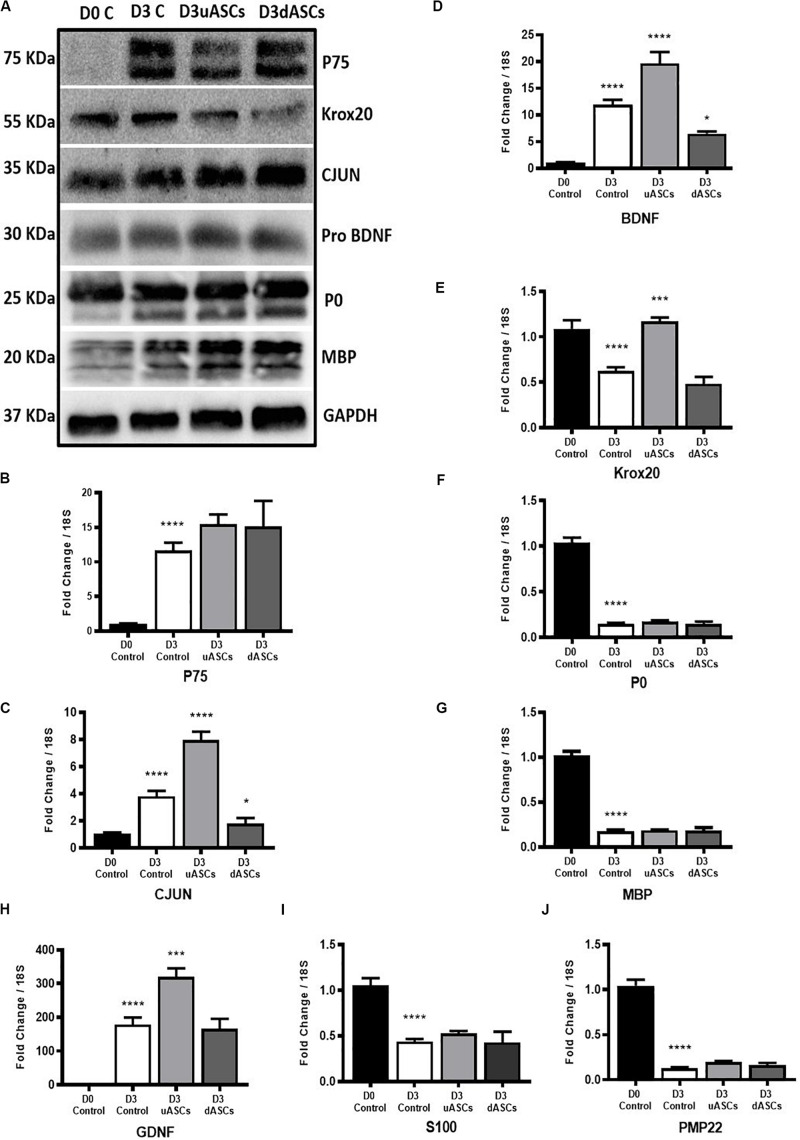
FIGURE 5.
Gene and protein expression results of key transcription factors, Schwann cell markers, neurotrophic factors and myelin proteins of Wallerian degeneration model application. Indirect co-culture with both undifferentiated and differentiated adipose stem cells (uASCs, dASCs). (A) Protein expression of P75, KROX20, CJUN PRO-BDNF, P0 and MBP showing: an increase in the expression of P75 by five-fold at D3 without intervention and almost the same folds increase with AD-MSCs intervention compared to D0 control. An increase in expression of CJUN at D3 without intervention and continued upregulation by 30% for AD-MSCs and 50% fold for dASCs intervention compared to D0 control. Protein expression of KROX20 showing: upregulation of KROX20 at D3 without intervention with 30% and 50% downregulation at both AD-MSCs and dASCs intervention, respectively, compared to D0 control. No change in PRO-BDNF expression at D3 control, AD-MSCs and dASCs intervention compared to D0 control. Protein expression of myelin proteins showing: persistence of P0 and MBP proteins at D3 control and after stem cell intervention. (B) P75 gene expression is upregulated in all D3 groups compered to D0 control that is further potentiated with both AD-MSCs and dASCs intervention. (C) Cjun gene expression is upregulated at D3 control group and AD-MSCs intervention markedly upregulates it gene expression in uASCs and dASCs were compared regarding D3c not D0 control whereas dASCs downregulates Cjun transcripts compared to D3 control levels (D) Bdnf gene expression is upregulated in all D3 groups compared to D0 control. AD-MSCs further potentiates this upregulation while dASCs intervention supresses it compared to D3 control group. (E) Krox20 gene expression is downregulated at D3 non-interventional control group there is marginal downregulation with with dASCs intervention compared to D3 control; however, significant upregulation is noticed with AD-MSCs intervention compared to D3 control. (F) Significant downregulation of P0 gene in all D3 groups compared to D0 control (G) Significant downregulation of Mbp gene in all D3 groups compared to D0 control. (H) The Gdnf gene is upregulated in all D3 groups compared to D0 control. Relative to D3 non-interventional control, AD-MSCs upregulates Gdnf levels but no effect is observed in the dASCs group. (I) S100 gene expression is significantly downregulated to roughly about the same degree in nerves in all D3 groups compared to D0 control. (J) Pmp22 gene expression is significantly downregulates in all D3 groups compared to D0 control. Gene data is presented as mean ± SEM (error bars) by one-way ANOVA (Tukey’s multiple comparison test) (*P < 0.05, **P < 0.01, ***P < 0.001, ****P < 0.0001).

