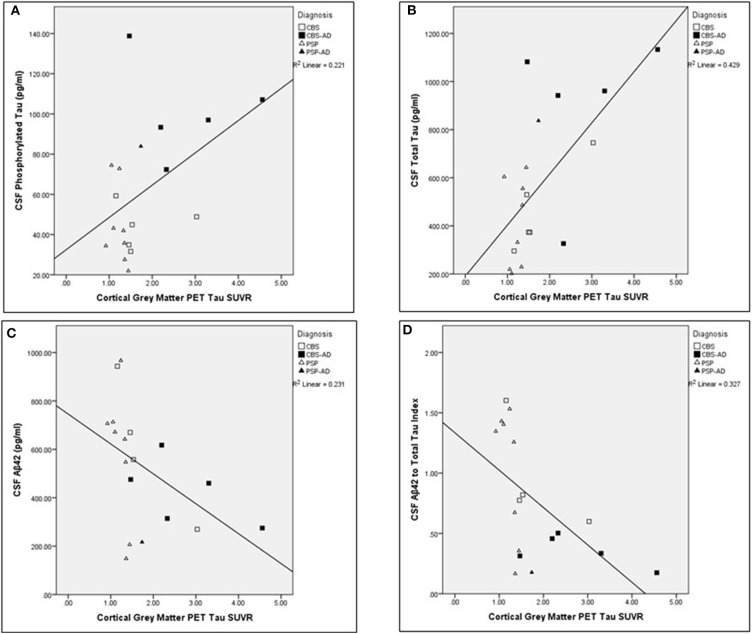
Figure 2.
Associations between cortical gray matter PET tau SUVR values and cerebrospinal fluid analysis measures across the whole cohort. Scatter plots presenting associations between cortical gray matter PET tau SUVR and the following cerebrospinal fluid (CSF) measures: (A) phosphorylated tau (pg/ml; adjusted p > 0.1), (B) total tau (pg/ml; adjusted p < 0.05), (C) Aβ42 (pg/ml; adjusted p < 0.05), and (D) Aβ42 to t-tau index (adjusted p < 0.05). Pearson partial correlations with age as a covariate. FDR Benjamini–Hochberg adjusted p-values, significant at p < 0.05.

