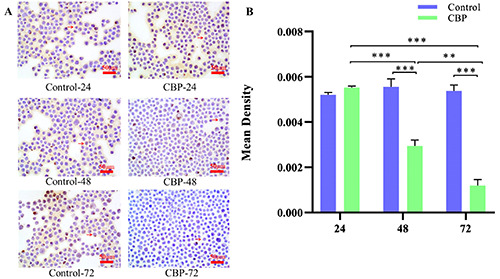
Figure 2.

Bcl-2 protein expression in different groups by ICC. A) Expression of the Bcl-2 protein decreased in the CBP-48 and CBP- 72 groups compared with that in the Control-48 and Control-72 groups, respectively, and the difference was extremely significant (***P<0.001). B) Expression of the Bcl-2 protein was reduced in the CBP-48 and CBP-72 groups compared with the CBP-24 group with an extremely significant difference (***P<0.01), and the level of this protein was significantly decreased in the CBP-72 group compared with that of the CBP-48 group (**P<0.01).
