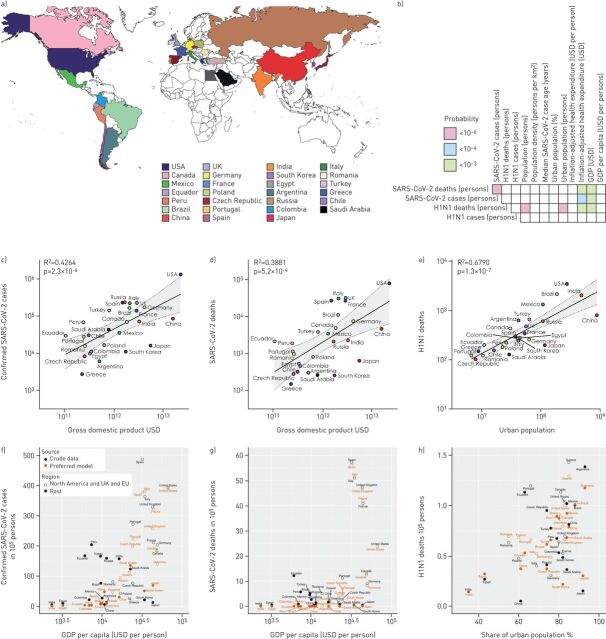
FIGURE 1.
Severe acute respiratory syndrome coronavirus 2 (SARS-CoV-2) and H1N1 influenza pandemics in 27 countries. a) Colour-coded map and legend of the 27 countries analysed on 12 May 2020. b) Heatmap of the correlations observed on 12 May 2020. c–e) Significant bivariate correlations of the SARS-CoV 2 and H1N1 outbreaks with socioeconomic indices. Shown are color-coded raw data points, Pearson's correlation coefficients (R2) and probability values (p), and linear regression lines with 95% confidence intervals (grey zones). GDP: annual gross domestic product. f–h) Crude rates for population-adjusted SARS-CoV-2 deaths and cases and H1N1 deaths in comparison with country-specific rates expected by the preferred general linear model.

