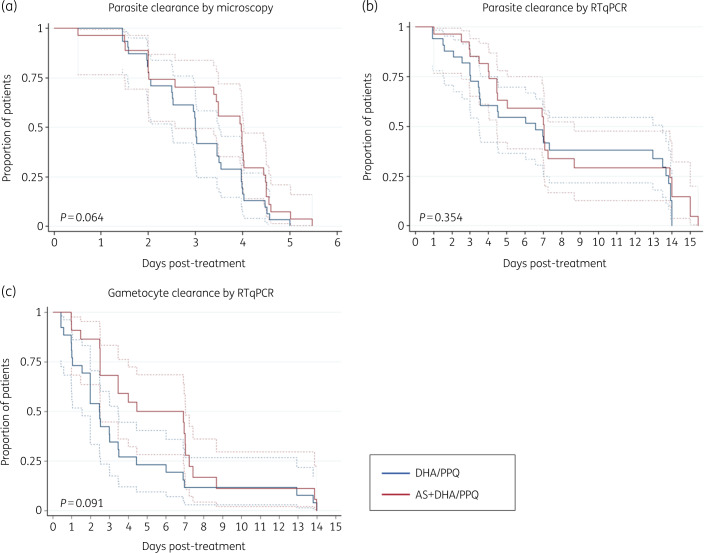
Figure 2.
Kaplan–Meier curves for time to parasite clearance by treatment arm. (a) Asexual parasitaemia by light microscopy (n = 60); (b) asexual parasitaemia by PfA18S RT–qPCR (n = 50); (c) gametocytes by Pfs25 RT–qPCR (n = 50). Time was computed in hours since treatment administration. No measurements were conducted between Day 7 and Day 14 (some patients were sampled on Day 15 for logistical reasons). Dashed lines indicate 95% CI. P values were calculated using log-rank test. DHA/PPQ, dihydroartemisinin/piperaquine; AS, artesunate.

