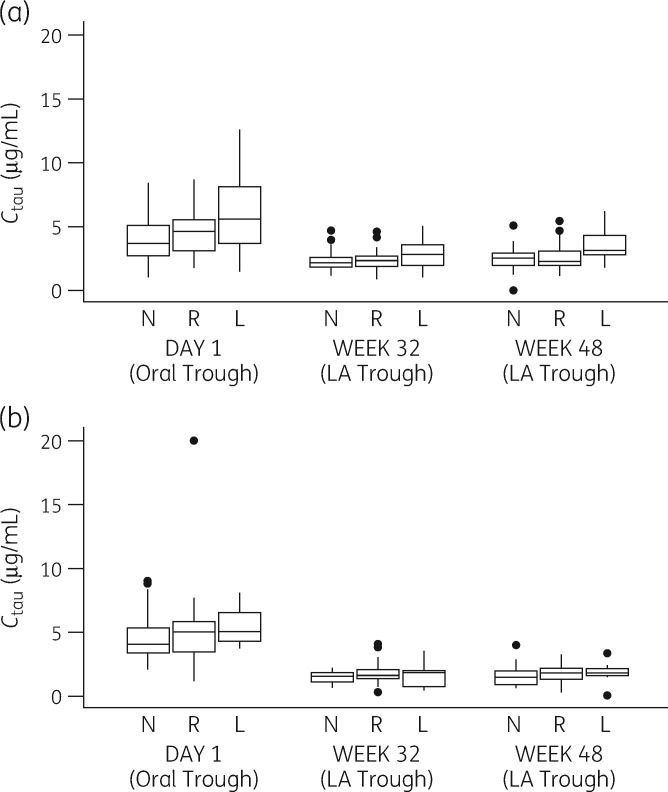
Figure 3.
Trough cabotegravir concentrations for oral versus IM administration according to predicted UGT1A1 activity in subjects from LATTE-2 (NCT02120352) for (a) IM administration every 4 weeks and (b) IM administration every 8 weeks. L, low predicted UGT1A1 activity; N, normal predicted UGT1A1 activity; R, reduced predicted UGT1A1 activity. On Day 1, oral cabotegravir trough was assessed 20–28 h after the last oral cabotegravir 30 mg dose taken at home. Boxes represent the range between the 25th and 75th percentiles, the horizontal lines within the boxes show medians and whiskers show the 5th and 95th percentiles.

