Figure 1.

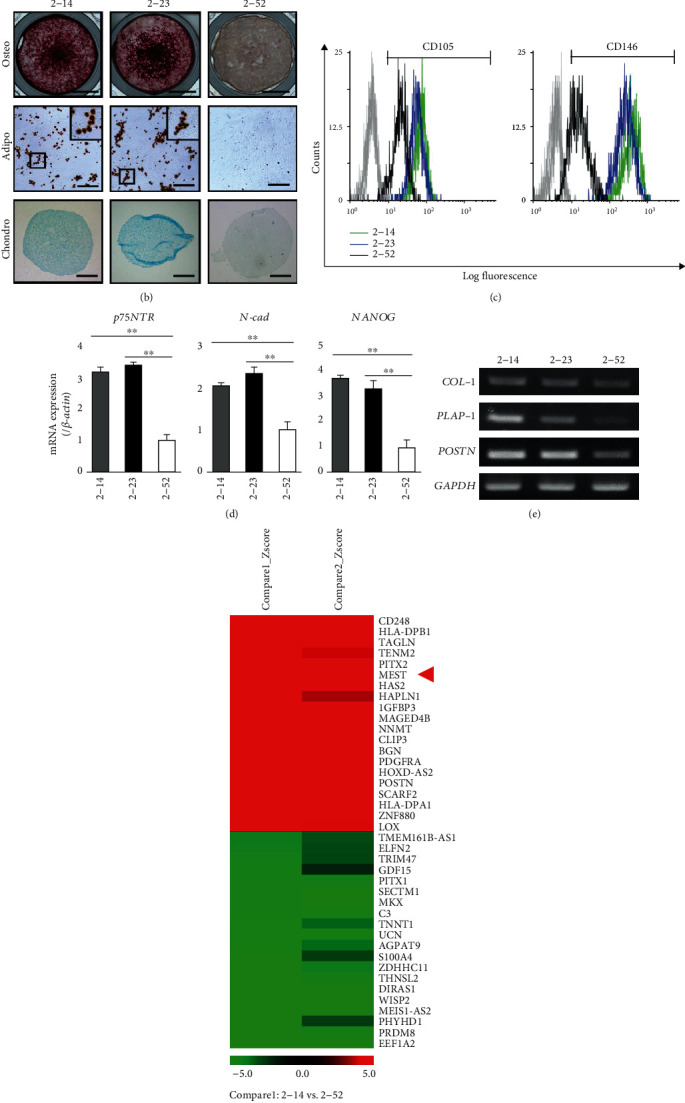
Identification of MEST by microarray analysis. (a–e) The characterization of 2-14, 2-23, and 2-52 cells. (a) Phase-contrast view of three cell lines (bars = 40 μm). (b) The multidifferentiation capacity for osteoblasts, adipocytes, and chondrocytes of three cell lines. Alizarin red S staining of cells cultured in osteoblastic differentiation medium for 3 weeks (top row: bars = 5 mm). Oil Red O staining of cells cultured in adipogenic inductive condition for 3 weeks. Inset: higher magnified view of Oil red O-positive lipid (medium row: bars = 20 μm). Alcian blue staining of cells cultured in chondrogenic inductive condition for 4 weeks (bottom row: bars =200 μm). (c) The expression intensities of CD105 and CD146 of 2-14 (green line), 2-23 (blue line), and 2-52 (black line) cells was demonstrated by flow cytometric analysis. In the gated region, positive cells. (d) The gene expression of p75NTR, N-cadherin, and NANOG in three cell lines was examined by quantitative RT-PCR. It was normalized against β-actin expression. All values are means ± S.D. (error bars) of quadruplicate assays. ∗∗p < 0.01. (e) The gene expression of Type-1 collagen (COL-1), PLAP-1, and Periostin (POSTN) in three cell lines was examined by semiquantitative RT-PCR. It was normalized against GAPDH expression. (f) Microarray analysis comparing gene expression among three cell lines (left column: 2-14 vs. 2-52 (compare1); right column: 2-23 vs. 2-52 (compare2)). Heatmap was generated by MeV software. Rows represent the genes, and columns represent the samples. Colors indicate the distance from the median of each row (red blocks: high; green blocks: low; black blocks: similar expression).
