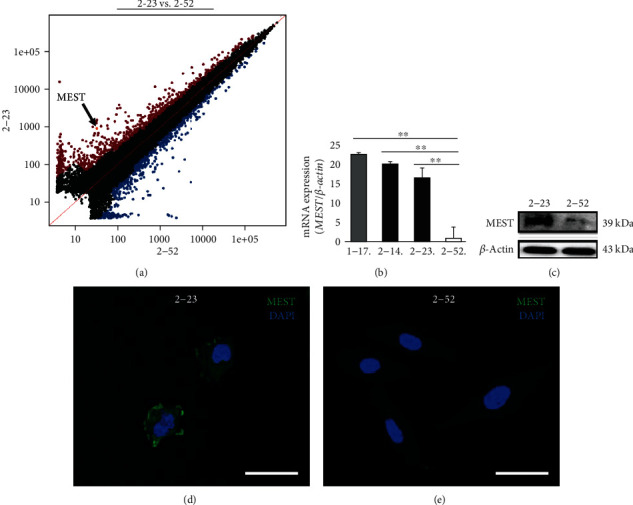
Figure 2.

The expression of MEST in human PDLSC lines. (a) Scatterplots representing the expression of genes in 2-23 and 2-52 cells in microarray analysis. (b) The expression of MEST mRNA in 1-17 (grey column), 2-14 (left black column), 2-23 (right black column), and 2-52 (white column) cells was assessed by quantitative RT-PCR. It was normalized against β-actin expression. All values are means ± S.D. (error bars) of quadruplicate assays. ∗∗p < 0.01. (c) The expression of MEST protein in 2-23 and 2-52 cells was assessed by western blot analyses. It was normalized against β-actin expression. (d, e) The localization of MEST in 2-23 (d) and 2-52 (e) cells was examined by immunofluorescence staining (anti-MEST: green, DAPI: blue; bars: 20 μm).
