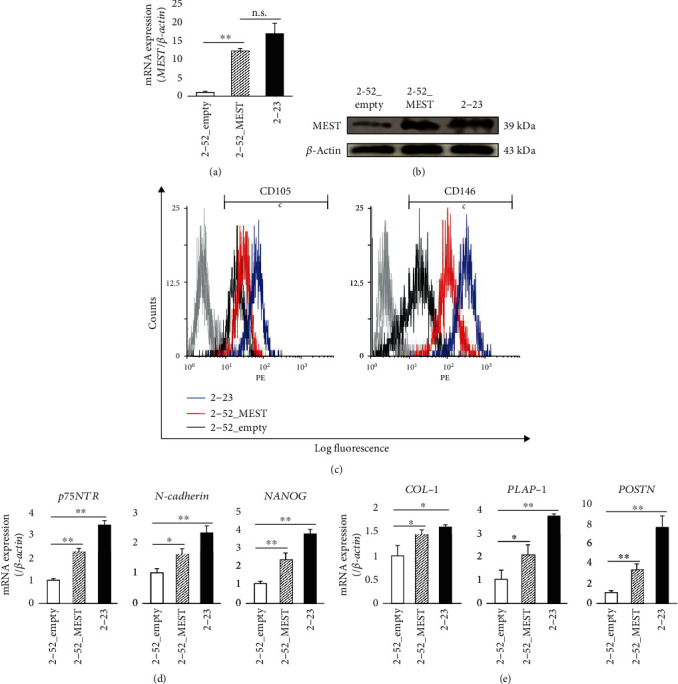
Figure 5.

The effects of MEST overexpression on the expression of stem cell markers and PDL-related markers in 2-52 cells. (a, b) The expression of MEST mRNA (a) and protein (b) in 2-52 cells transfected with empty vector (2-52_empty), 2-52 cells transfected with vector coding human MEST (2-52_MEST), and 2-23 cells was assessed by quantitative RT-PCR and western blot analyses, respectively. (c) The expression intensities of CD105 and CD146 in 2-52_empty (black line), 2-52_MEST (red line), and 2-23 cells (blue line) were demonstrated by flow cytometric analysis. In the gated region, positive cells. (d) The gene expression of p75NTR, N-cadherin, and NANOG in 2-52_empty, 2-52_MEST, and 2-23 cells was assessed by quantitative RT-PCR. (e) The gene expression of COL-1, PLAP-1, and POSTN in 2-52_empty, 2-52_MEST, and 2-23 cells was assessed by quantitative RT-PCR. (a, d, e) In quantitative RT-PCR, the expression levels of these genes were normalized against β-actin expression. All values are means ± S.D. (error bars) of quadruplicate assays. ∗∗p < 0.01, ∗p < 0.05; n.s.: not significant.
