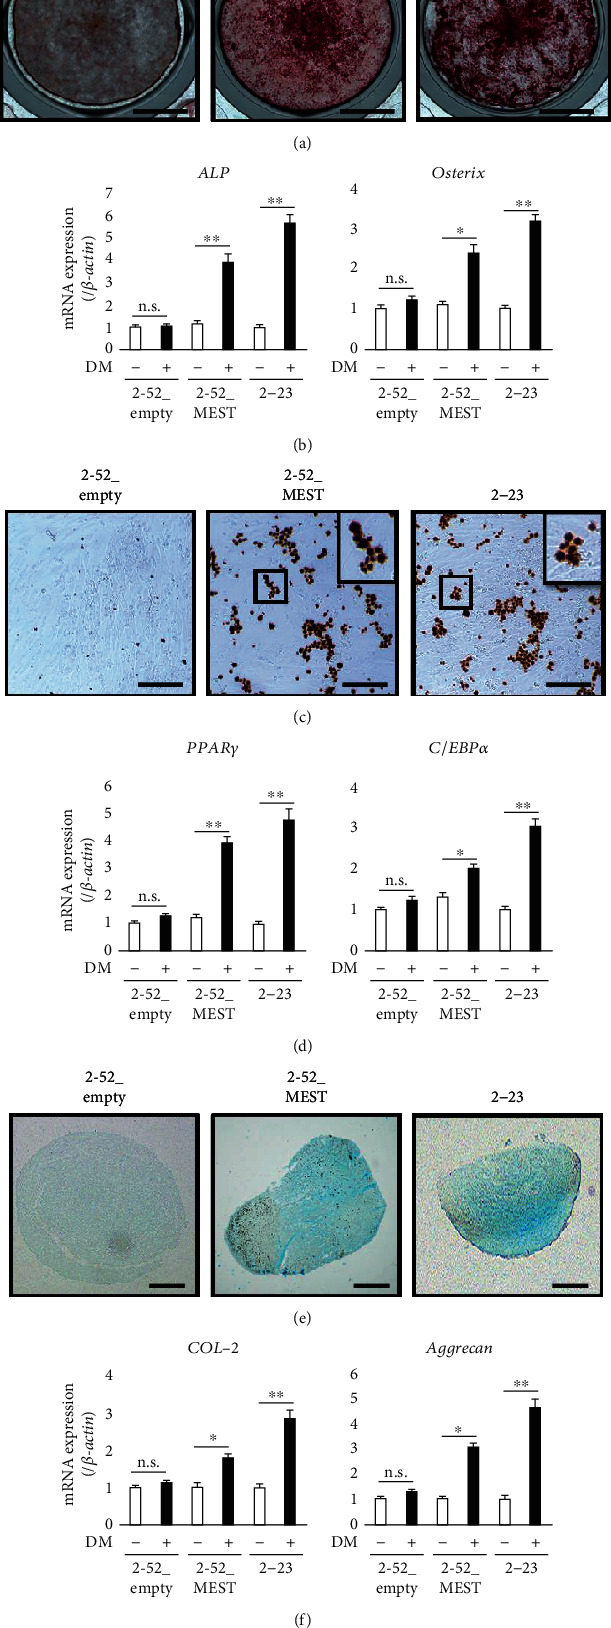
Figure 6.

The effects of MEST overexpression on the multidifferentiation capacity in 2-52 cells. (a) The formation of mineralized nodules in 2-52_empty or 2-52_MEST was examined by Alizarin red S staining after culture in osteogenic DM for 3 weeks (bars: 5 mm). (b) The gene expression of ALP and Osterix in 2-52_empty or 2-52_MEST, which were cultured with or without DM for 3 days, was assessed by quantitative RT-PCR. (c) The lipid vacuoles in 2-52_empty or 2-52_MEST were examined by Oil red O staining after culture in adipogenic DM for 3 weeks (bars: 20 μm). (d) The gene expression of PPARγ and C/EBPα in 2-52_empty or 2-52_MEST, which were cultured with or without DM for 3 days, was assessed by quantitative RT-PCR. (e) The cartilaginous matrix in 2-52_empty or 2-52_MEST was examined by Alcian blue staining after culture in chondrogenic DM for 4 weeks (bars: 200 μm). (f) The gene expression of COL-2 (k) and Aggrecan (l) in 2-52_empty or 2-52_MEST, which were cultured with or without DM for 3 days, was assessed by quantitative RT-PCR. All values are means ± S.D. (error bars) of quadruplicate assays (n = 4, ∗∗p < 0.01, ∗p < 0.05. n.s.: not significant).
