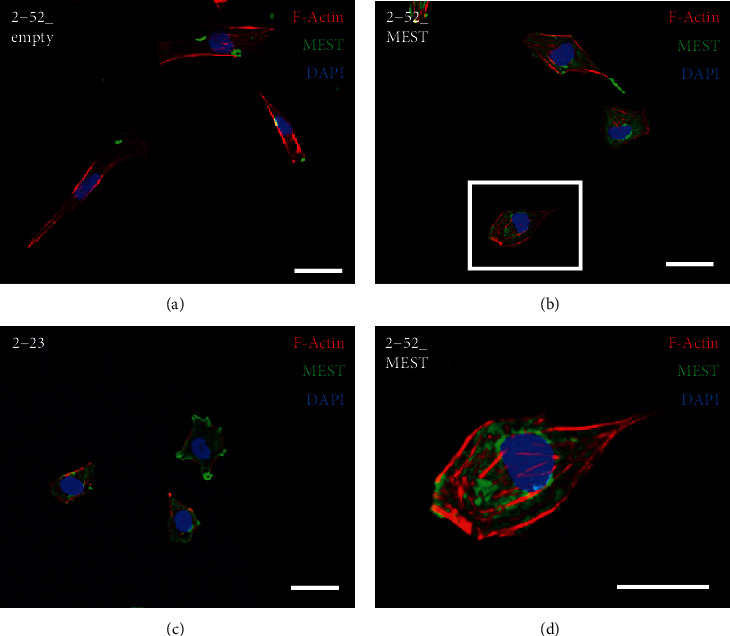
Figure 7.

The effects of MEST overexpression on the cell morphology in 2-52 cells. (a–c) The cell morphology was investigated by immunofluorescence staining in 2-52_empty (a), 2-52_MEST (b), and 2-23 cells (c). (d) Highly magnified view of a boxed area in (b). Nuclei were stained with DAPI, and F-actin was stained with phalloidin (F-actin: red; anti-MEST: green; DAPI: blue; bars: 10 μm).
