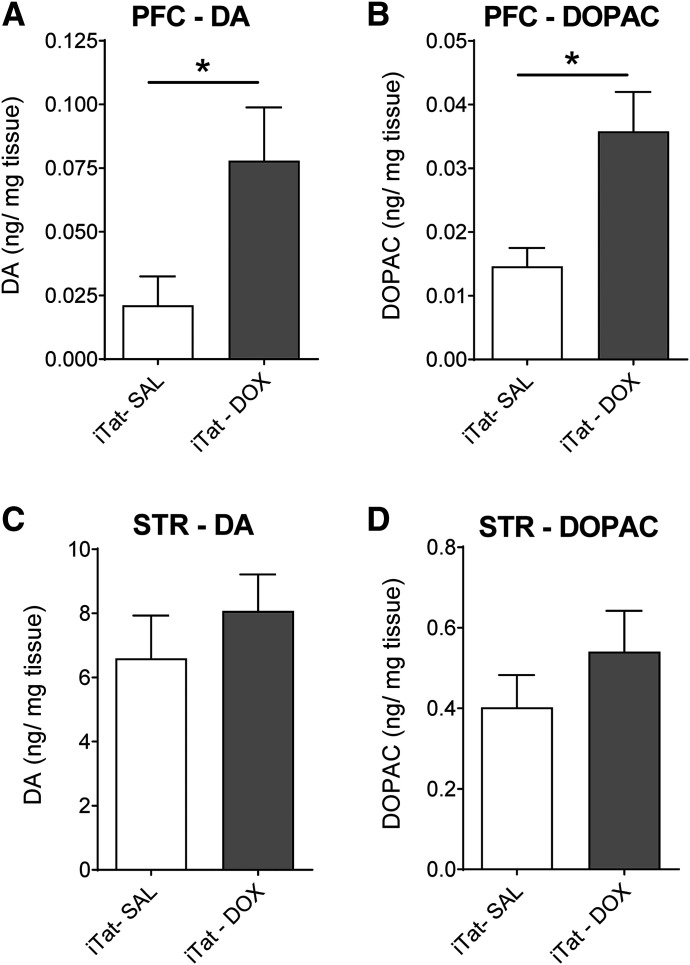
Fig. 4.
DA and DOPAC tissue content in the PFC and striatum of iTat-tg mice after 7 days’ administration of saline or Dox. Top panels: DA (A) and DOPAC (B) tissue content in the PFC of iTat-tg (iTat) mice from Dox-treated (DOX) or saline-treated (SAL) control groups. Bottom panels: DA (C) and DOPAC (D) tissue content in striatum (STR) of iTat-tg mice from Dox-treated or saline-treated control groups. Data are expressed as nanograms per milligram tissue (mean ± S.E.M.) from five to six mice per group. *P < 0.05, compared with saline control group.

