
Figure 5.
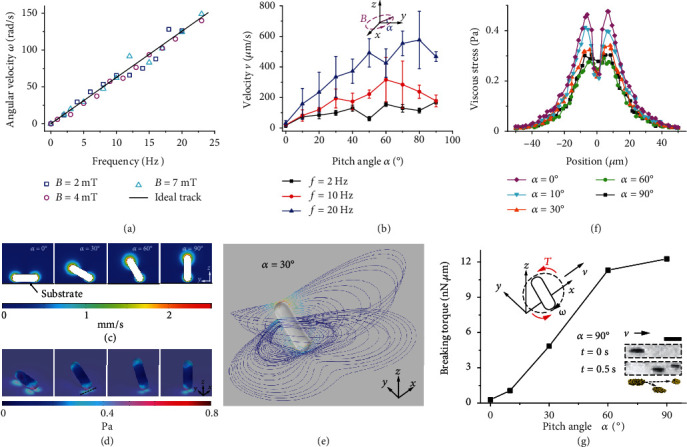
Interactions with boundaries of rotating MNEs. (a) Frequency response of the MNEs under magnetic fields with different strengths. (b) Velocity of the MNEs under magnetic fields with different pitch angles. The magnetic flux density was 4 mT, and the error bar shows the standard error of the velocities obtained from five samples. The inset shows a rotating magnetic field with a pitch angle α. (c) Velocity fields around pitched MNEs. The color scale indicates the magnitude of the fluid velocity. (d) The viscous stress distribution on the surface of the pitched MNEs and the substrate. The color scale indicates the magnitude of the viscous stress. (e) Streamlines near the MNE (Materials and Methods). The color of the streamlines indicates the fluid velocity, and the color scale is same as that in (c). (f) The viscous stress distribution along the line on the substrate in the forward +x direction. This line is the dashed line shown in (d), which is the projection of the nearest boundary of the MNE on the substrate during rotation. (g) Breaking torque exerted on the MNEs. The upper inset illustrates the breaking torque T. The lower inset shows an MNE breaking into two fragments during translational motion in (b) at 10 Hz, and the bar corresponds to 50 μm. Data in (c)–(g) are obtained from the simulation based on the experiments in (a) and (b).