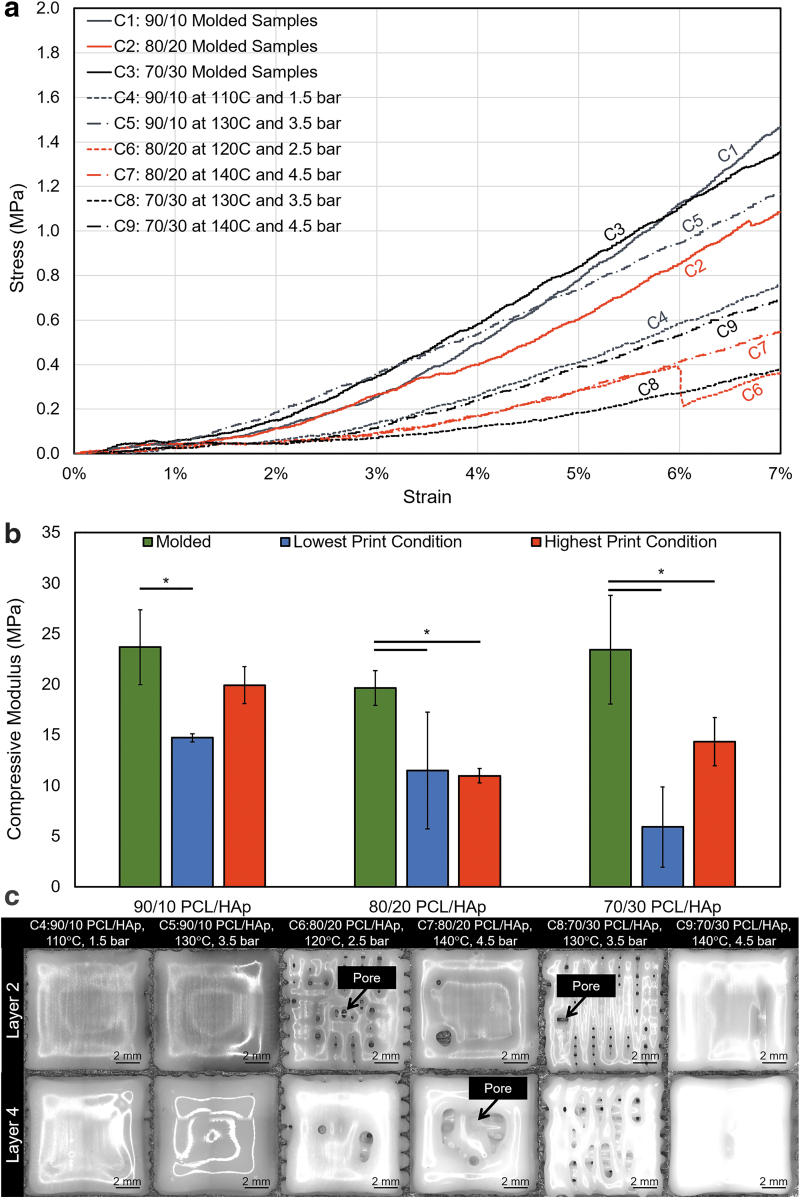
FIG. 5.
Compression testing results of molded and printed PCL/HAp. (a) Compressive behavior of representative samples for PCL/HAp combinations, which were either molded or printed at the lowest and highest print condition under consideration for a PCL/HAp composition. (b) Average compressive modulus results of each PCL/HAp mixture ratio and compression sample preparation method (n = 4 per group; α = 5% for the comparison of printed and molded samples for a composition). (c) In situ images from the lowest performing compressive modulus sample from each PCL/HAp composition at the lowest and highest printing condition arrangements. Statistically significant differences are denoted by an asterisk; α = 5%.

