
Figure 1:
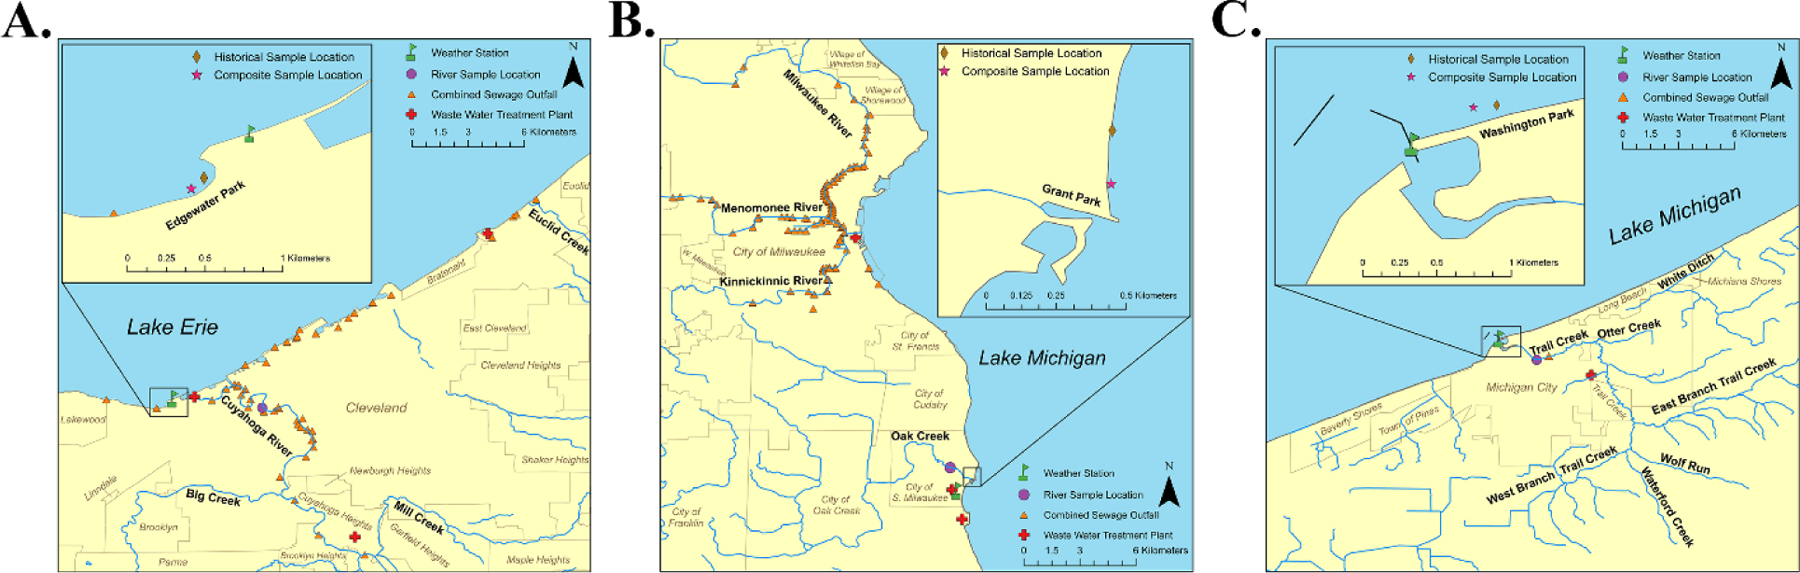
Global information system of map of Edgewater (Panel A), Grant Park (Panel B), and Washington Park (Panel C) study areas. Note that location of composite sampling sites (C) are represented by a single point in each study area.
Official websites use .gov
A
.gov website belongs to an official
government organization in the United States.
Secure .gov websites use HTTPS
A lock (
) or https:// means you've safely
connected to the .gov website. Share sensitive
information only on official, secure websites.
Global information system of map of Edgewater (Panel A), Grant Park (Panel B), and Washington Park (Panel C) study areas. Note that location of composite sampling sites (C) are represented by a single point in each study area.