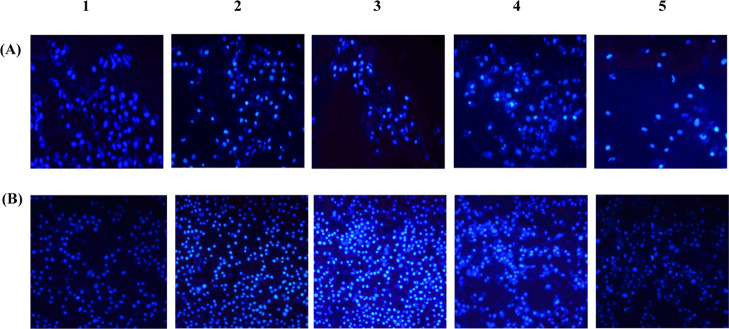
Figure 9.
(A and B) Morphological observation of treated human lung cancer cell line (A-549) and human cervical cancer cell line (HeLa) with different lectin concentrations: (1) control, (2) 0.5× IC50 μg/mL, (3) 1× IC50 μg/mL, (4) 2× IC50 μg/mL, and (5) positive control treated with doxorubicin further stained with Hoechst stain.

